
Market Overview for KAITO/Tether (KAITOUSDT)
Summary
• KAITO/Tether (KAITOUSDT) broke key support near 0.5650 on declining volume.
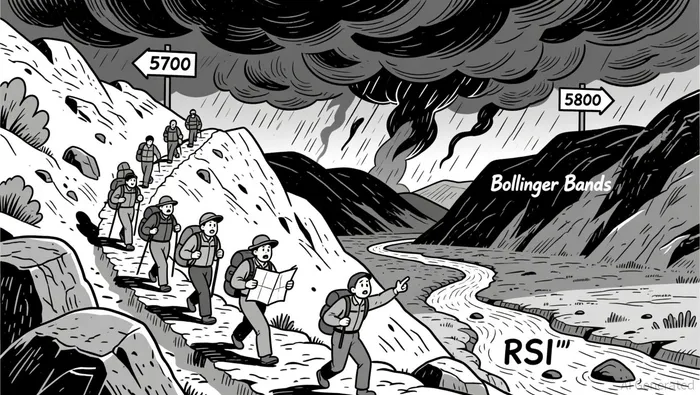
• Price formed bearish engulfing patterns near 0.5700 and 0.5800, signaling potential short-term weakness.
• RSI suggests oversold conditions below 30, hinting at possible near-term rebound.
• Volatility expanded as price traded within widening Bollinger Bands, indicating increased uncertainty.
• Turnover spiked early in the session, followed by divergence with price weakness in the final hours.
KAITO/Tether (KAITOUSDT) opened at 0.5717 on 2026-01-15 12:00 ET and closed at 0.5485 by 12:00 ET on 2026-01-16. The pair reached a high of 0.5897 and a low of 0.5411. Total volume for the 24-hour period was 25,474,000.9 and notional turnover amounted to approximately 14,046,184.5.
Structure and Key Levels
Price action showed multiple bearish engulfing patterns, especially at 0.5700 and 0.5800, indicating growing bearish pressure. A critical support level appears to have been broken near 0.5650, with a new support forming around 0.5411. On the upside, the 0.5750 and 0.5800 levels may offer potential resistance if a rebound occurs.
Trend and Momentum
The 20 and 50-period moving averages on the 5-minute chart show a bearish crossover, reinforcing downward momentum. MACD remains in negative territory, suggesting ongoing bearish momentum. RSI reached oversold levels below 30 near the close, indicating that a short-term bounce could be in play.
Volatility and Bollinger Bands
Volatility expanded significantly during the session, as seen by the widening of the Bollinger Bands. Price closed near the lower band, suggesting increased bearish sentiment and elevated uncertainty among traders.
Volume and Turnover
Volume surged early in the session, coinciding with the high near 0.5897, but diverged as price moved lower in the final hours. Turnover peaked around 20:00 ET and declined afterward, showing diminishing interest in aggressive shorting or long covering.
Fibonacci Retracements
Fibonacci levels on the recent 5-minute swing from 0.5650 to 0.5897 suggest that 0.5750 (38.2%) and 0.5700 (50%) acted as temporary resistance. The 61.8% level at 0.5620 now appears as a potential target for further downside, should the current bearish trend continue.
Price may find near-term support near 0.5411 and 0.5450, with a possible test of the 0.5600 level if buyers re-engage. Traders should remain cautious of further volatility and potential breakdowns below 0.5411.
Decoding market patterns and unlocking profitable trading strategies in the crypto space
Latest Articles
Stay ahead of the market.
Get curated U.S. market news, insights and key dates delivered to your inbox.


Comments
No comments yet