
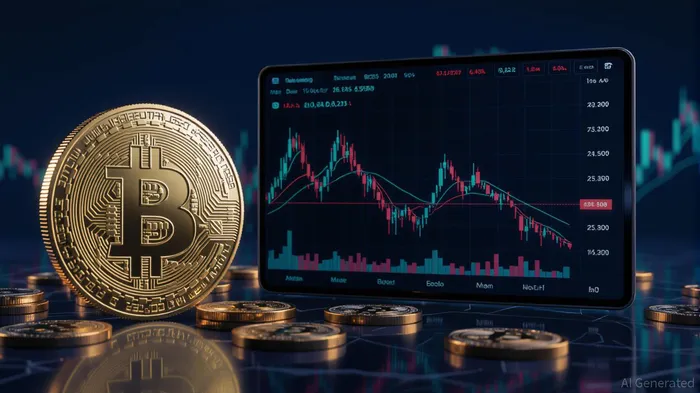
Market Overview for IOTA/Tether (IOTAUSDT) - 2025-09-16
• IOTA/Tether (IOTAUSDT) closed near the session high, showing positive momentum in the last 24 hours.
• Volatility increased during the 19:00–20:30 ET window, indicating a period of intensified trading activity.
• A bullish engulfing pattern emerged around 19:15–19:30 ET, suggesting short-term buying pressure.
• RSI and MACD signals indicate the asset is neither overbought nor oversold but showing moderate upward momentum.
• Volume and turnover were highest during the 19:00–20:30 ET period, aligning with price action and confirming trend strength.
IOTA/Tether (IOTAUSDT) opened at $0.1861 on 2025-09-15 at 12:00 ET and reached a high of $0.1895 before closing at $0.1882 on 2025-09-16 at 12:00 ET. The 24-hour volume was 10,451,871.0 IOTAIOTA--, with a notional turnover of approximately $1,960,000.
Structure & Formations
The price of IOTAUSDT formed a series of bullish patterns throughout the session, including a bullish engulfing candle during the 19:15–19:30 ET window, where the close exceeded the prior candle’s open, indicating a shift in sentiment. Key resistance levels were observed near $0.1875 and $0.1895, with notable rejections and pullbacks observed at these levels. A key support zone appears to be forming near $0.1860–$0.1865, where buyers have shown resilience multiple times in the 24-hour window.
Moving Averages
On the 15-minute chart, the 20-period and 50-period moving averages crossed into a bullish alignment during the afternoon and evening hours, with the 20 MA crossing above the 50 MA. This suggests strengthening near-term momentum. On the daily timeframe, the 50-day MA remains above the 100-day and 200-day MA, indicating a longer-term bullish bias.
MACD & RSI
The MACD showed a positive crossover and held above the signal line for much of the session, signaling sustained momentum. RSI moved from mid-50s to upper 60s during the afternoon and evening, suggesting rising optimism without entering overbought territory. A divergence between price and RSI was not observed, meaning the bullish trend appears to be intact and supported by trader sentiment.
Bollinger Bands
Bollinger Bands expanded during the 19:00–20:30 ET period, coinciding with a sharp price rally and increased volatility. Price action remained within the bands for the majority of the session, with a few close calls near the upper band during the late evening hours. The recent volatility expansion suggests an increase in market uncertainty or activity, which could precede a breakout or consolidation phase.
Volume & Turnover
Volume was highest during the 19:00–20:30 ET period, with over 1.2 million IOTA traded. This volume spike coincided with a price rally, providing confirmation for the move. Turnover (notional value) mirrored this, with the peak occurring during the same period. No divergence was observed between volume and price, indicating strong alignment between buying pressure and price action.
Fibonacci Retracements
Applying Fibonacci retracement levels to the recent 15-minute swing from $0.1841 to $0.1895, key retracement levels at 61.8% (~$0.1869) and 38.2% (~$0.1877) were tested multiple times. Price found support at $0.1869–$0.1870 during the 00:00–01:30 ET window and again later in the day, reinforcing the importance of these levels. A break above $0.1895 could signal a continuation of the uptrend, while a failure to hold $0.1860 may indicate a short-term reversal.
Backtest Hypothesis
A potential backtesting strategy would involve entering long positions when the 20-period MA crosses above the 50-period MA on the 15-minute chart, with a stop-loss placed below the most recent support level identified (~$0.1860). A take-profit target could be set at the next Fibonacci level (~$0.1877) or the upper BollingerBINI-- Band. This setup would aim to capture momentum-driven rallies while controlling risk via defined stop-loss levels. The recent bullish engulfing pattern and confirmation from RSI and MACD provide a favorable entry setup under this framework.
Decoding market patterns and unlocking profitable trading strategies in the crypto space
Latest Articles
Stay ahead of the market.
Get curated U.S. market news, insights and key dates delivered to your inbox.

AInvest
PRO
AInvest
PRO
Comments
No comments yet