
Market Overview: Hooked Protocol/Tether 24-Hour Update
Summary
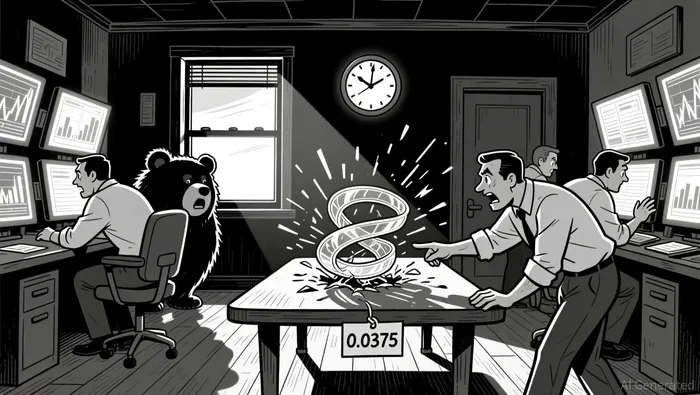
• Price action shows consolidation around key 0.0375 support with no clear breakout.
• Momentum indicators suggest weakening bullish pressure and moderate bearish traction.
• Volume remains steady during active hours, but turnover diverges after 00:00 ET.
• Bollinger Bands remain narrow, signaling subdued volatility and potential for a breakout.
• No strong candlestick patterns confirmed, but bearish shadows appear in the early morning session.
Hooked Protocol/Tether (HOOKUSDT) traded between 0.0366 and 0.0379 on 2025-12-31, closing at 0.0370 after opening at 0.0376 the previous day. Total volume reached 6.8 million, with notional turnover of $253,500 over the 24-hour period.
Structure & Moving Averages
Price tested 0.0375 as a potential support level but failed to hold after 02:00 ET. The 5-minute 20-period moving average drifted lower, while the 50-period line remained flat, indicating short-term bearish bias. Daily MA indicators showed no clear trend amid low volatility.
Momentum and Oscillators
RSI on the 5-minute chart oscillated between 45 and 52, suggesting a neutral to bearish stance. MACD crossed into negative territory after 00:15 ET, confirming a slowdown in bullish momentum.
Volatility and Volume
Bollinger Bands remained compressed through the early session but widened after 01:00 ET, indicating rising uncertainty. Notional turnover diverged from price after 00:00 ET, suggesting diminished conviction in price action.
Fibonacci and Key Levels
Price approached the 38.2% Fibonacci retracement of the 0.0366–0.0379 range, but failed to rebound. A break below 0.0370 may trigger further testing of the 0.0365–0.0366 zone.
The next 24 hours may see renewed volatility if volume increases alongside a directional breakout. Investors should monitor the 0.0370–0.0375 range closely for potential turning points, with a risk of increased downside if support fails to hold.
Descifrar patrones de mercado y desarrollar estrategias de trading rentables en el ámbito de las criptomonedas.
Latest Articles
Stay ahead of the market.
Get curated U.S. market news, insights and key dates delivered to your inbox.


Comments
No comments yet