
Market Overview for Highstreet/Tether (HIGHUSDT)


Summary
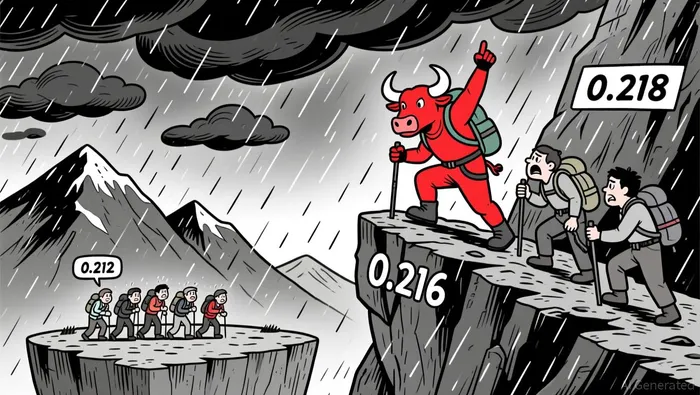
• Price drifted between $0.212 and $0.218, forming a consolidation pattern ahead of key resistance.
• Volatility increased in the final hours, with a large bullish 5-minute candle near session close.
• MACD turned positive late in the session, suggesting renewed short-term buying momentum.
• RSI hovered near neutral, indicating no immediate overbought or oversold signals.
• Volume spiked above average near resistance levels, confirming but not breaking key price thresholds.
Market Overview
Highstreet/Tether (HIGHUSDT) opened at $0.214 on December 15 at 12:00 ET, reached a high of $0.218, touched a low of $0.212, and closed at $0.217 by December 16 at 12:00 ET.
 . The 24-hour trading volume totaled 1,079,940.75, with a notional turnover of approximately $229,806.54.
 Structure & Formations
The price remained within a tight range for most of the session, with a key consolidation forming between $0.212 (support) and $0.218 (resistance). A bullish engulfing pattern emerged near $0.216 late in the session, suggesting short-term bullish bias. A doji formed around $0.215 earlier in the day, indicating indecision. The price did not decisively break above the $0.218 level.
MACD & RSI
The MACD crossed into positive territory late in the session, with a small bullish divergence forming. The RSI moved from neutral to mildly overbought near $0.218 but failed to sustain above 60. This suggests that while short-term momentum is building, it may not be enough to push the price beyond the consolidation range without a catalyst.
Bollinger Bands
Volatility expanded slightly in the last 3 hours, with the bands widening. Price spent most of the session in the middle of the bands but edged closer to the upper band in the final hour. A breakout attempt near $0.218 failed, indicating that the upper bound remains strong resistance.
Volume & Turnover
Volume spiked above average in the final hours, particularly during the $0.216–$0.218 range. Notional turnover mirrored the volume increase, confirming that buying pressure was genuine. No significant divergence was observed between volume and price action.
Fibonacci Retracements
Applying a Fibonacci retracement to the recent $0.212–$0.218 swing, the 50% level at $0.215 acted as a key pivot point. The 61.8% level at $0.216 became a focal point, where a large bullish candle formed. The failure to break above $0.218 may indicate a 78.6% retracement target is unlikely without further strength.
The price may test the $0.218–$0.220 range in the next 24 hours if buyers regain control, but risks remain of a pullback into $0.212–$0.214 if the current consolidation fails to hold. Investors should closely monitor volume and momentum indicators for confirmation of the next directional move.
Decoding market patterns and unlocking profitable trading strategies in the crypto space
Latest Articles
Stay ahead of the market.
Get curated U.S. market news, insights and key dates delivered to your inbox.


Comments
No comments yet