
Market Overview for Highstreet/Tether (HIGHUSDT)
Summary
• Price consolidates between 0.234 and 0.238 on 5-minute chart with key resistance at 0.239.
• Volume surges above 100k at 0.239 suggest possible short-term buying interest.
• RSI remains neutral while MACD trends upward, indicating building momentum.
• Bollinger Bands show mild contraction, hinting at a potential breakout.
• Fibonacci retracements align with recent swing highs near 0.24, offering potential targets.
Highstreet/Tether (HIGHUSDT) opened at 0.233 on 2025-12-12 12:00 ET and closed at 0.238 by 12:00 ET on 2025-12-13. The 24-hour range was between 0.232 and 0.240, with a total volume of 169,994.414 and a notional turnover of $41,569.73 (assuming TetherUSDT-- price of $1.00).
Structure & Moving Averages
On the 5-minute chart, price oscillated between 0.234 and 0.239. 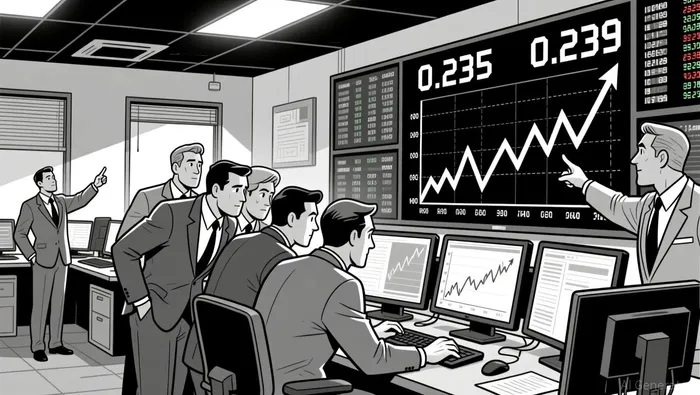 The 20-period and 50-period moving averages showed a slight positive divergence, with the 50 MA acting as dynamic support near 0.235. On the daily chart, no long-term averages were breached, but price hovered above the 50 and 100-day MAs, signaling moderate bullish bias.
Momentum and Volatility
MACD remained positive and trending upwards, suggesting growing bullish momentum. RSI hovered between 50 and 58, indicating neither overbought nor oversold conditions. Bollinger Bands were narrowly compressed in the early part of the day, hinting at a consolidation phase, but widened in the afternoon with increased volatility near 0.239.
Volume and Turnover
Volume spiked dramatically above 100k at 15:30 ET and 16:15 ET, coinciding with price attempts to break above 0.239 and 0.240. Notional turnover mirrored this activity, particularly on the 0.239-0.240 level. No significant divergence was noted between price and volume, suggesting genuine interest rather than wash trading.
Fibonacci Retracements
The 38.2% and 61.8% Fibonacci levels aligned with 0.237 and 0.239, respectively, based on the 0.232 to 0.240 swing. Price stalled at the 61.8% level in the late hours, which may signal a short-term ceiling unless followed by a bullish breakout with increased volume.
Looking ahead, a sustained move above 0.239 may attract more buyers and test the 0.240-0.241 resistance cluster. However, traders should remain cautious of potential pullbacks if volume does not confirm a strong breakout.
Descifrar los patrones de mercado y desarrollar estrategias de trading rentables en el ámbito de las criptomonedas.
Latest Articles
Stay ahead of the market.
Get curated U.S. market news, insights and key dates delivered to your inbox.


Comments
No comments yet