
Market Overview for GoPlus Security/Tether (GPSUSDT)
Summary
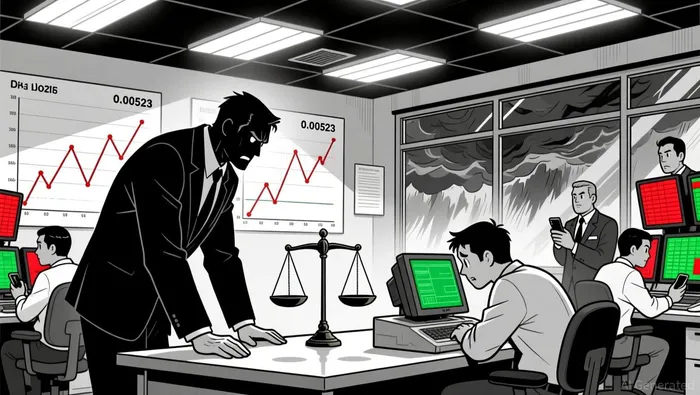
• Price action formed consolidation patterns near 0.00523, suggesting short-term indecision.
• Volatility expanded in the early hours, with volume spiking over 2 million contracts at 03:15 ET.
• RSI signaled overbought conditions at 0.00526 before a pullback to 0.00523, hinting at near-term profit-taking.
GoPlus Security/Tether (GPSUSDT) opened at 0.00523 on January 1 at 12:00 ET, reached a high of 0.00526, and a low of 0.00518, closing at 0.00523 by 12:00 ET January 2. Total 24-hour volume was 12,346,814.2 and turnover was approximately $64,031.58.
Structure & Formations
The price formed a bearish engulfing pattern at 18:00 ET, followed by a consolidation phase at 0.00523. A doji appeared at 00:30 ET, signaling a potential short-term reversal. Support levels held near 0.00521 and 0.0052, with resistance forming around 0.00524 and 0.00526.
Moving Averages
A 5-minute 20SMA crossed below a 50SMA in the early hours, indicating a potential bearish bias. On the daily timeframe, the 50DMA appears to be acting as a dynamic support, with the price hovering slightly above it.
MACD & RSI
MACD turned negative after 18:00 ET, with the histogram showing bearish divergence. RSI peaked near 75 at 03:15 ET before a sharp pullback, suggesting overbought conditions and possible short-term profit-taking.
Bollinger Bands
Volatility expanded between 03:15 and 04:00 ET, pushing the price to the upper band before a pullback. The price has since traded within the band, indicating a period of consolidation.
Volume & Turnover
Volume spiked over 2.1 million at 03:15 ET, confirming a key high at 0.00526. Turnover rose sharply with this move, suggesting a strong short-term bullish impulse followed by reversal. No major divergence between volume and price was observed.
Fibonacci Retracements
A recent 5-minute swing from 0.00521 to 0.00526 saw the price retrace to 0.00524 (38.2%) and then to 0.00523 (50%), indicating potential support. Daily retracement levels from a recent swing high suggest key support may hold near 0.0052.
The market appears to be in a state of short-term consolidation following a sharp intraday high. While momentum indicators show bearish divergence, the price remains above key support. Investors may want to monitor 0.00523 closely for potential breakout or breakdown in the next 24 hours. As always, traders should be mindful of potential liquidity shifts and avoid overleveraging in low-visibility conditions.
Decoding market patterns and unlocking profitable trading strategies in the crypto space
Latest Articles
Stay ahead of the market.
Get curated U.S. market news, insights and key dates delivered to your inbox.


Comments
No comments yet