
Market Overview for Golem/Bitcoin (GLMBTC)
Summary
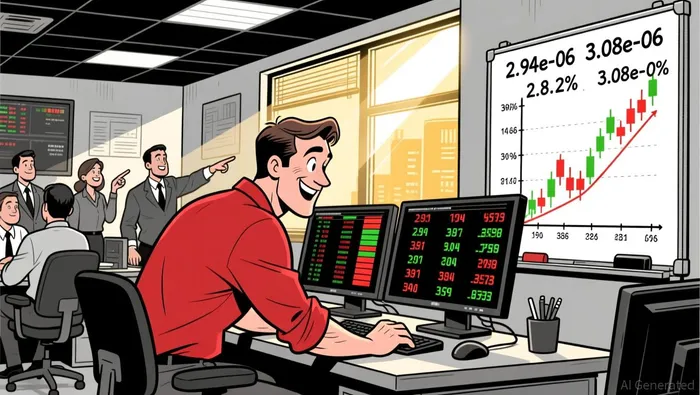
• Price action showed a bullish reversal at 2.94e-06 with a potential 38.2% Fib target at 3.08e-06.
• Momentum picked up in the late-night hours with RSI pushing toward overbought territory.
• Bollinger Bands expanded post-22:00 ET, signaling increased volatility and potential continuation.
• Volume spiked sharply at 02:30 ET, confirming a strong move lower into 2.99e-06.
Golem/Bitcoin (GLMBTC) opened at 2.96e-06 at 12:00 ET–1, touched a high of 3.21e-06, and a low of 2.93e-06, closing at 2.99e-06 at 12:00 ET. Total volume reached 1,069,676.0 and turnover was approximately 3.097 BTC, showing significant activity despite mixed direction.
Structure & Formations
Price found strong support at 2.94e-06 after multiple attempts to break through, forming a bullish reversal pattern around that level. A 38.2% Fibonacci retracement target aligned with 3.08e-06 became a key resistance after a sharp rally from 2.96e-06.
Moving Averages
On the 5-minute chart, the 20-period MA crossed above the 50-period MA, forming a potential short-term bullish signal. On the daily chart, price remains above the 200-period MA, suggesting a continuation of the broader uptrend.
MACD & RSI
The MACD histogram showed a strong positive surge from 02:00 ET onward, coinciding with a move above the zero line. RSI reached 68 during the early morning, signaling rising momentum but not yet overbought.
Bollinger Bands
Volatility increased sharply after 22:00 ET, with Bollinger Bands expanding and price moving toward the upper band. This suggests a period of strong directional movement that may consolidate in the near term.
Volume & Turnover
Volume peaked at 469,624 at 02:30 ET, with a corresponding drop in price to 2.99e-06, confirming bearish conviction. Turnover also spiked at that time, aligning with price movement and reinforcing the strength of the bearish bias.
GLMBTC may test the 2.94e-06 level again in the next 24 hours, with a potential bounce or breakdown depending on volume confirmation. Traders should monitor RSI levels and key Fib levels for potential reversal or continuation signals.
Decoding market patterns and unlocking profitable trading strategies in the crypto space
Latest Articles
Stay ahead of the market.
Get curated U.S. market news, insights and key dates delivered to your inbox.


Comments
No comments yet