
Market Overview for Golem/Bitcoin (GLMBTC)
Summary
• Price action showed bearish momentum after a failed 2.99e-06 resistance test.
• Volume spiked at 18:15 ET and again at 00:30 ET, confirming bearish continuation.
• Bollinger Bands contracted mid-session, followed by a sharp drop below the lower band.
• RSI remains in oversold territory, suggesting possible near-term support at 2.83e-06.
Golem/Bitcoin (GLMBTC) opened at 3e-06 on 2026-01-16 at 12:00 ET, reached a high of 2.99e-06, and fell to a low of 2.83e-06 before closing at 2.83e-06 on 2026-01-17 at 12:00 ET. The 24-hour volume totaled 158,510.0 units with a notional turnover of 0.45285 BTC.
Structure & Formations
Price tested the 2.99e-06 level twice, forming bearish rejection patterns before breaking down to 2.83e-06. A large bearish engulfing candle on the 5-minute chart confirmed the breakdown. The key support level now appears to be 2.83e-06, with 2.91e-06 acting as a short-term resistance.
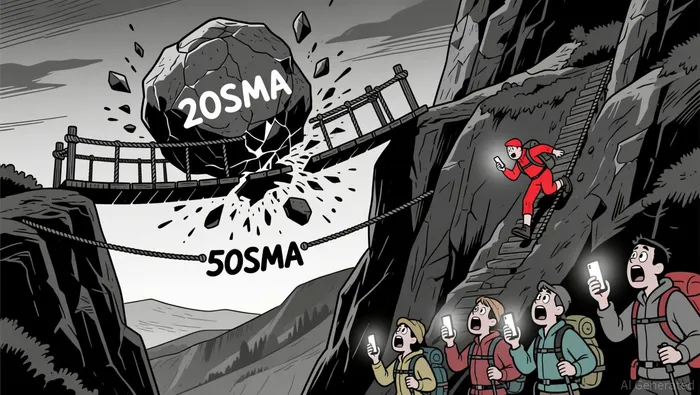
Moving Averages
On the 5-minute chart, price closed below both the 20SMA and 50SMA, reinforcing bearish bias. Daily moving averages suggest a continuation of the downtrend, with the 200SMA providing a distant potential support at ~2.85e-06.
MACD & RSI
MACD remained bearish with the signal line above the histogram throughout the session. RSI entered oversold territory below 30, signaling potential for a short-term bounce. However, divergence between RSI and price movement suggests further downside remains likely.
Bollinger Bands
A volatility contraction was observed mid-session, followed by a sharp move below the lower Bollinger Band, indicating increased bearish pressure. Prices may remain within the bands unless there is a strong catalyst for a breakout.
Volume & Turnover
Trading volume spiked at 18:15 ET (10,042 units) and again at 00:30 ET (15,391 units), coinciding with key breakdowns. Turnover remained low compared to the previous day, suggesting limited institutional activity.
Fibonacci Retracements
From the 2.99e-06 high to the 2.83e-06 low, the 38.2% Fibonacci level is at 2.91e-06 and could act as near-term resistance. A potential 61.8% retracement at 2.86e-06 may offer some support before retesting the 2.83e-06 level.
Price appears to be forming a bearish consolidation pattern near 2.83e-06, with the potential for a rebound off key support levels. Investors should remain cautious about the risk of further downside in the next 24 hours, particularly if volume continues to support bearish momentum.
Descifrar patrones de mercado y desarrollar estrategias de trading rentables en el ámbito de las criptomonedas.
Latest Articles
Stay ahead of the market.
Get curated U.S. market news, insights and key dates delivered to your inbox.


Comments
No comments yet