
Market Overview for GMX/USDC on 2026-01-16
Summary
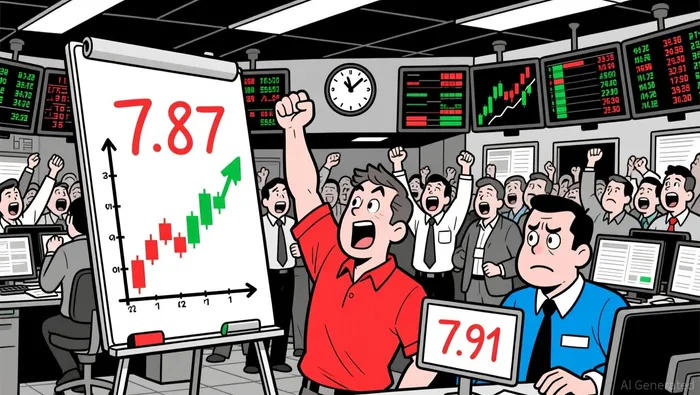
• GMX/USDC tested key support at $7.87, rebounding with a bullish reversal candle.
• Momentum diverged after midday, with RSI signaling potential overbought conditions.
• Bollinger Band contraction suggests low volatility, but a breakout appears imminent.
• Notional turnover surged near 8:00 ET, coinciding with a sharp rebound from $7.87.
GMX/USDC opened at $7.89 at 12:00 ET − 1 and traded between $7.79 and $7.96 before closing at $7.87 at 12:00 ET today. Total volume was 1,807.93, and notional turnover reached $14,155.99 over the 24-hour window.
Structure & Formations
Price tested $7.87 multiple times, forming a bullish reversal pattern on the 5-minute chart after a sharp drop. A strong green candle confirmed the support level. Resistance appears to have shifted to $7.95, where price briefly stalled before retreating. A doji formed at $7.91, signaling indecision and potential consolidation ahead.
Moving Averages and Momentum
A 50-period moving average on the 5-minute chart crossed above the 20-period line, suggesting short-term bullish momentum. However, RSI reached overbought territory above 70 during the late-night rebound, hinting at potential pullback. MACD showed a narrow histogram with a positive crossover, reinforcing the possibility of a bounce.
Volatility and Bollinger Bands
Bollinger Bands had been compressing throughout the day, indicating low volatility, but the late rebound pushed price toward the upper band, suggesting a potential breakout. The widening of the bands during the $7.87–$7.96 move may signal increased uncertainty ahead.
Volume and Turnover
Volume surged near 8:00 ET when price rebounded from $7.87, coinciding with a large-volume candle and $2,320 notional turnover. This suggests accumulation or aggressive buying. Divergence between price and volume was observed after 8:00 ET, with price continuing higher while volume waned, possibly foreshadowing a consolidation phase.
Fibonacci Retracements
The $7.87–$7.96 swing saw a 61.8% retracement at $7.91, where price briefly stalled. A 38.2% retest at $7.88 appears to have acted as support earlier in the day, validating key Fibonacci levels as potential turning points for the next 24 hours.
Price may test $7.91–$7.95 as the next resistance cluster, and a break above could signal a retesting of the day’s high. However, overbought RSI and waning volume may constrain further upside, suggesting a cautious approach ahead of the next 24 hours.
Decoding market patterns and unlocking profitable trading strategies in the crypto space
Latest Articles
Stay ahead of the market.
Get curated U.S. market news, insights and key dates delivered to your inbox.


Comments
No comments yet