
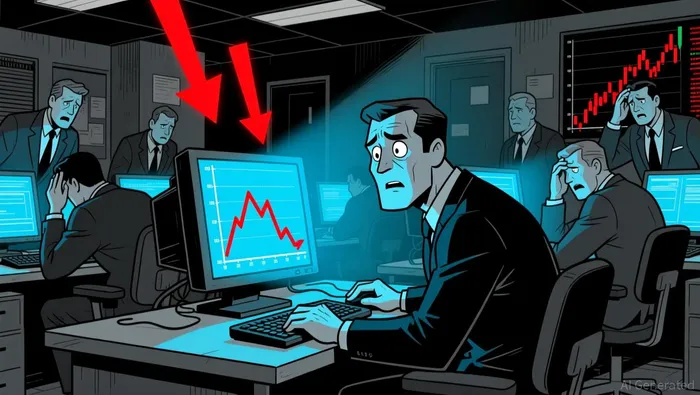
Market Overview for GMX/USDC on 2025-12-24
Summary
• GMX/USDC opened at $8.17 and closed at $8.11 after a volatile 24-hour session.
• A sharp selloff occurred in the early hours, with price dropping to 8.11.
• Volume spiked during the selloff but dropped sharply after 08:00 ET.
• A bearish engulfing pattern emerged near 8.17-8.19, signaling potential continuation lower.
• Price consolidated near 8.11 with no clear reversal signs, suggesting continued bearish bias.
GMX/USDC traded between $8.11 and $8.27 over the past 24 hours, opening at $8.17 and closing at $8.11 by 12:00 ET. The pair recorded a total volume of 1,347.72 and a notional turnover of $10,967.29 (calculated from OHLCV data).
Structure & Formations
Price action shows a bearish breakdown from the 8.17–8.19 consolidation range, marked by a bearish engulfing pattern. A key support level appears to be forming near $8.11, where the price has stalled for several hours. Resistance at $8.22 has failed to hold during multiple tests, indicating weakening bullish momentum.
Moving Averages
On the 5-minute chart, the 20 and 50-period moving averages have both turned sharply lower, confirming a bearish tilt. Daily moving averages (50, 100, 200) are likely aligned with this bearish bias, though exact values are not available in the provided dataset.
MACD & RSI
Momentum indicators suggest a strong bearish phase. The RSI has fallen into oversold territory near 30, which may indicate a potential bounce but does not confirm a reversal. MACD is negative and declining, reinforcing bearish momentum.
Bollinger Bands
Volatility increased during the selloff to $8.11, with price breaking below the lower Bollinger Band. The bands have since contracted, suggesting a potential period of consolidation or another directional move.
Volume & Turnover
The most aggressive selloff occurred between 18:00 and 19:30 ET, where turnover spiked. Volume then sharply declined after 08:00 ET, indicating waning interest. The divergence between price and volume suggests a possible pause in the downward trend.
Fibonacci Retracements
Recent swings from 8.11 to 8.27 show a 61.8% retracement near $8.19, which has acted as a key resistance level. If price breaks below the 38.2% level at $8.14, it could signal a deeper bearish phase.
Price appears to be in a consolidation phase near $8.11 and may test this level again in the next 24 hours. Investors should monitor for a break below $8.11 for confirmation of a new downtrend, but risk remains skewed to the downside in the near term.
Decoding market patterns and unlocking profitable trading strategies in the crypto space
Latest Articles
Stay ahead of the market.
Get curated U.S. market news, insights and key dates delivered to your inbox.


Comments
No comments yet