
Market Overview for Gains Network/Tether (GNSUSDT)
Summary
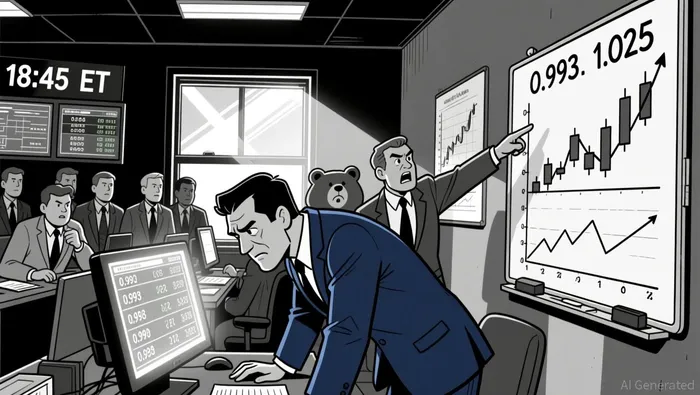
• Price consolidates between 0.993 and 1.025, with key support near 0.995 and resistance around 1.02.
• Volume surged during the 18:45 ET selloff but has since faded, indicating potential exhaustion.
• RSI remains below 50, suggesting bearish momentum; MACD signals weak positive divergence near 1.00.
• Bollinger Bands expanded midday, showing increased volatility before retracing lower.
• Fibonacci retracement levels at 1.016 and 1.003 may dictate near-term directional bias.
The 24-hour period for GNSUSDT opened at 1.023 on 2026-01-11 at 12:00 ET and closed at 1.001 on 2026-01-12 at 12:00 ET, with a high of 1.025 and a low of 0.993. Total traded volume was 103,748.66, and notional turnover reached approximately 103,830.07.
Structure & Key Levels
Price action formed a broad range between 0.993 and 1.025, with consolidation below the critical 1.023 resistance. A bearish engulfing pattern appeared around 18:45 ET, followed by a doji near 1.005, indicating indecision. The 1.003–1.006 zone appears to be a short-term pivot level.
Trend and Momentum Indicators
On the 5-minute chart, the 20-EMA crossed below the 50-EMA, reinforcing bearish bias. The 50-period daily MA appears to hold as support at ~1.004. RSI dropped below 50 and remained in neutral territory, while MACD generated a modest positive divergence near 1.00, suggesting potential short-covering.
Volatility and Turnover
Volatility spiked midday due to the selloff from 1.023 to 1.014, but waned after 20:00 ET. Notional turnover peaked at 18:45 ET but failed to drive price back toward previous highs, indicating waning bullish participation.
Fibonacci and Bollinger Bands
Fibonacci retracement levels show 1.016 and 1.003 as potential support clusters. Bollinger Bands expanded during the selloff, with price closing near the lower band, suggesting bearish continuation pressure.
The market appears poised for a test of 0.995 as key support in the next 24 hours. A breakout above 1.006 may trigger a short-covering rally. Investors should remain cautious as volume has not confirmed a strong directional bias.
Decoding market patterns and unlocking profitable trading strategies in the crypto space
Latest Articles
Stay ahead of the market.
Get curated U.S. market news, insights and key dates delivered to your inbox.


Comments
No comments yet