
Market Overview for FUNToken/Tether on 2025-12-25
Summary
• Price tested a key resistance near 0.001705 before pulling back.
• Volatility expanded in early morning trade, pushing price above 0.001712.
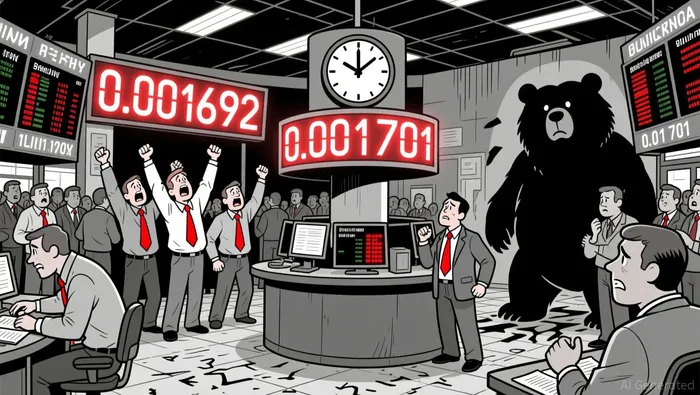
• A large bullish engulfing pattern formed near 0.001692, suggesting potential bullish momentum.
• RSI approached overbought territory, hinting at possible near-term profit-taking.
• Turnover surged above 50M FUN with strong volume during the 0700–0900 ET window.
FUNToken/Tether (FUNUSDT) opened at 0.001688 on 2025-12-24 12:00 ET and closed at 0.001687 as of 12:00 ET on 2025-12-25. The 24-hour high was 0.001717, and the low was 0.001671. Total volume reached 81,295,107.0 FUN, with a notional turnover of approximately $137,060, calculated using the average price of 0.001703.
Structure & Formations
Price tested a resistance at 0.001705, where it reversed sharply. A bullish engulfing pattern emerged at 0.001692, suggesting buying pressure. A potential support level appears near 0.001683, which held during two pullbacks. A key bearish divergence formed at 0.001701, where price hit a high but volume failed to confirm the move.
Technical Indicators
The RSI approached 65 during the peak at 0.001717, suggesting overbought conditions and possible near-term profit-taking. MACD showed a bullish crossover during the morning rally but diverged at the high. Price traded near the upper Bollinger Band during the morning, indicating high volatility. The 5-minute 20 and 50 SMA lines showed a bullish crossover during the morning push.
Volume & Turnover
Volume surged during the 0700–0900 ET window, confirming the morning breakout to 0.001717. Turnover exceeded 50M FUN during this time, with a high of 111,202,560.0 FUN at the 0800 ET candle. Volume and price action aligned positively during the bullish push but diverged slightly during the afternoon consolidation.
Price Projections & Fibonacci
Using recent 5-minute swings, a Fibonacci retracement suggests possible support at 0.001690 (38.2%) and 0.001683 (61.8%). On the daily chart, a 61.8% retracement of the recent high-to-low move may test 0.001698 if the trend continues.
Forward Outlook and Risk
Price appears to be consolidating after a strong morning push. A retest of 0.001705 could trigger further upside if volume confirms. Conversely, a close below 0.001683 could trigger a pullback. Investors should monitor volume on the next move above 0.001705 for confirmation.
Decoding market patterns and unlocking profitable trading strategies in the crypto space
Latest Articles
Stay ahead of the market.
Get curated U.S. market news, insights and key dates delivered to your inbox.


Comments
No comments yet