
Market Overview for Ethena/BNB on 2026-01-14
Summary
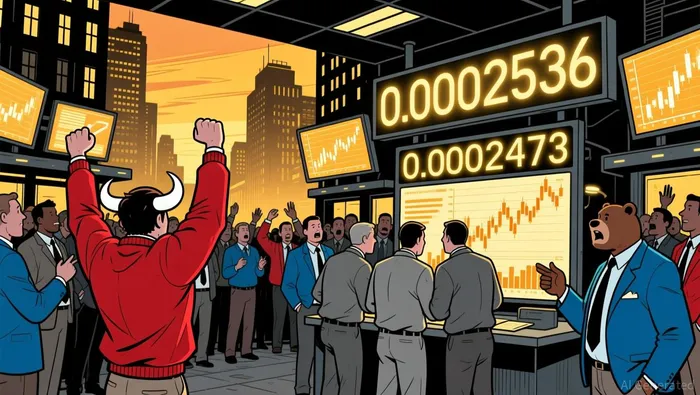
• Ethena/BNB oscillated between 0.0002416 and 0.0002657, forming a bullish engulfing pattern near 0.0002536.
• Momentum shifted late in the session with a sharp RSI divergence signaling potential exhaustion in the short-term bearish move.
• Volatility expanded mid-day, with Bollinger Bands widening and turnover surging on the 5-minute chart.
The Ethena/BNB pair (ENABNB) opened at 0.0002433, reached a high of 0.0002657, dipped to a low of 0.0002416, and closed at 0.0002573. Total volume was 157,623.02, and notional turnover amounted to 39.3754 across the 24-hour window.
Structure & Formations
The 5-minute chart revealed a bullish engulfing pattern at 0.0002536, suggesting a short-term reversal. A bearish divergence appeared as the price tested 0.0002416, but a follow-through breakdown failed. The market showed consolidation near 0.0002573, a key psychological level that may act as support or resistance in the near term.
Moving Averages and Momentum
 Short-term averages (20/50) crossed above the price during a mid-day rally, confirming bullish momentum. However, the RSI showed a bearish divergence at the session low, hinting at potential consolidation or a pullback. The MACD line flattened as price action stabilized, indicating neutral to mixed momentum.
Volatility and Bollinger Bands
Bollinger Bands expanded sharply following a breakout at 0.0002536, reflecting increased volatility. Price action remained within the upper band, signaling continuation of the bullish trend. A contraction was observed during early bearish pressure but was quickly reversed, confirming strength in the current move.
Volume and Turnover Analysis
High volume occurred during key price swings, particularly around 0.0002657 and 0.0002416. Turnover surged during the rally, suggesting strong conviction. However, minimal volume during the 0.0002416 test raises questions about the depth of bearish conviction, suggesting a possible short-term bottom.
Fibonacci Retracements
Fibonacci levels aligned with the 0.0002573 and 0.0002536 areas, which corresponded with key support and resistance on the 5-minute chart. The 61.8% retracement of the recent bearish leg was retested but held, indicating a potential base for a larger bullish move.
The market appears to be in a consolidation phase ahead of a potential breakout. While the bullish engulfing pattern and strong volume at key levels are encouraging, a failure to hold above 0.0002573 could lead to renewed bearish pressure. Investors should remain cautious and watch for volume confirmation on any directional move.
Desencriptando patrones de mercado y desbloqueando estrategias de comercio rentables en el entorno de criptomonedas
Latest Articles
Stay ahead of the market.
Get curated U.S. market news, insights and key dates delivered to your inbox.


Comments
No comments yet