
Market Overview for EigenLayer/Bitcoin (EIGENBTC): December 10, 2025


Summary
• Price declined from 5.7e-06 to 5.23e-06 over 24 hours, forming bearish continuation patterns.
• Key support tested near 5.23e-06, with volume surging as price dropped below 5.3e-06.
• RSI suggests oversold conditions, but MACD remains bearish with no sign of reversal.
• Volatility expanded, with Bollinger Bands widening and price hitting lower boundaries.
• Turnover increased at 5.3e-06 but failed to push price higher, hinting at weak buying pressure.
The EigenLayer/Bitcoin (EIGENBTC) pair opened at 5.66e-06 on December 9, peaked at 5.82e-06, and closed at 5.23e-06 on December 10. Daily volume totaled 64,181.16, with turnover of approximately $330,197.50.
Structure & Formations
Price moved in a bearish trend, forming multiple lower highs and lower lows. A key bearish engulfing pattern occurred near 5.7e-06 to 5.66e-06, followed by a long lower shadow at 5.3e-06 to 5.2e-06, suggesting rejection at lower levels. A possible support level may be forming at 5.23e-06, where the price found a floor.
Moving Averages
On the 5-minute chart, the 20SMA and 50SMA crossed bearishly, confirming the downtrend. Daily MAs are not computed here, but recent 5-minute momentum suggests price may continue to test the 50-day level before stabilizing.
MACD & RSI
MACD remained bearish with a negative histogram, reinforcing the downward momentum. 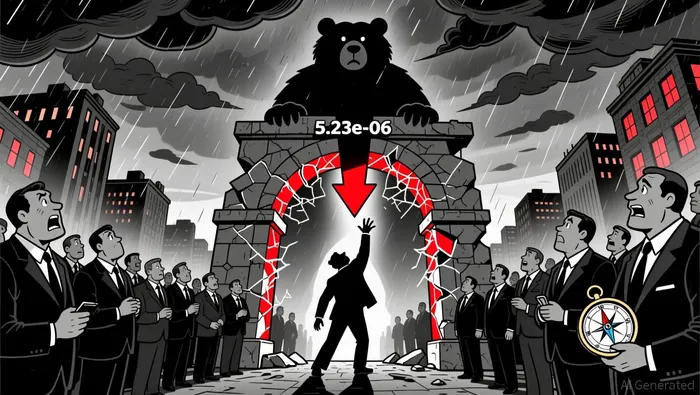 RSI fell into oversold territory around 30-35 during the late afternoon, but no strong reversal signal emerged, suggesting the downtrend may persist before a rebound.
Bollinger Bands
Volatility expanded sharply as price moved toward the lower band, hitting it at 5.23e-06. The band’s width increased, which may indicate a potential consolidation phase or a continuation of the trend.
Volume & Turnover
Volume surged as price moved below 5.3e-06, confirming bearish sentiment. However, higher turnover did not correspond with bullish price movement, indicating weak buying interest. A divergence between volume and price may suggest that further declines could be limited in the near term.
Fibonacci Retracements
On the 5-minute chart, price hit the 61.8% retracement level at 5.23e-06. This suggests a possible short-term support. If the price fails to hold this level, the next key target could be near 5.19e-06.
Looking ahead, if price holds above 5.23e-06, it may find short-term stability, but a break below this level could signal a deeper correction. Investors should monitor volume and RSI for signs of a potential reversal. As always, volatility remains high, and positions should be managed with caution.
Descifrar patrones de mercado y desarrollar estrategias de trading rentables en el ámbito de las criptomonedas.
Latest Articles
Stay ahead of the market.
Get curated U.S. market news, insights and key dates delivered to your inbox.


Comments
No comments yet