
Market Overview for Dogecoin/Tether (DOGEUSDT)
Summary
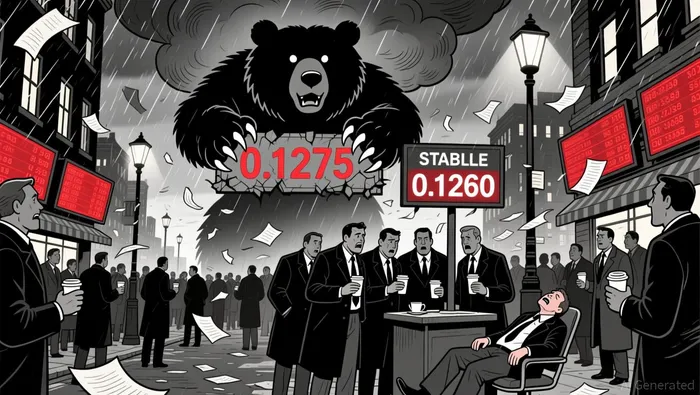
• DOGEUSDTDOGE-- broke below key support at 0.1260, closing near 0.1261.
• Volume surged in late ET hours, but failed to confirm a strong directional bias.
• RSI remains in oversold territory, hinting at potential for a short-term rebound.
• Bollinger Bands have expanded, reflecting increased volatility in the last 4 hours.
• A bearish engulfing pattern formed at 0.1275, suggesting continued downward momentum.
Dogecoin/Tether (DOGEUSDT) opened at 0.12619 at 12:00 ET−1, reached a high of 0.12972, a low of 0.12406, and closed at 0.12609 by 12:00 ET. Total volume was 678,224,665.0 DOGEDOGE--, with a notional turnover of $85.6M.
Structure & Formations
Price formed a bearish engulfing candle at 0.1275, signaling renewed selling pressure after earlier consolidation. A strong support level appears to have formed near 0.1255–0.1260 as price tested the range multiple times in the late ET hours. A doji near 0.1260 suggests indecision and may indicate a potential reversal or consolidation phase ahead.
Moving Averages and MACD
On the 5-minute chart, the 20-period MA dipped below the 50-period MA, reinforcing the bearish bias.
 MACD showed a weak crossover in the negative zone, reflecting fading momentum. The daily chart remains bullish, with 50-period MA above 100-period MA, highlighting a potential divergence between short and long-term trends.
 RSI and Bollinger Bands
Relative Strength Index (RSI) hovered near 28, indicating an oversold condition that could attract short-term buyers. Bollinger Bands widened in the last 4 hours, aligning with the sharp drop in price. Price currently trades near the middle band, suggesting it is consolidating within the recent volatility.
Volume and Turnover
Volume spiked sharply during the late ET decline, but turnover failed to confirm a strong bearish breakout, indicating mixed conviction. The largest turnover occurred during the 14:00–16:00 ET period, coinciding with a sharp intraday rally.
Fibonacci Retracements
Recent 5-minute swings show 0.1260 as the 61.8% retracement level from the intraday high at 0.1297. A break below this level could target 0.1245. On the daily chart, the 50% Fibonacci retracement remains intact at 0.1280, acting as a psychological level to watch.
Looking ahead, DOGEUSDT appears to have entered a consolidation phase near 0.1260. A break below 0.1255 may trigger a deeper correction, but oversold RSI conditions hint at potential for a short-covering bounce. Investors should watch for a potential reversal signal or further breakdown below key support levels. As always, the next 24 hours may bring sharp swings due to the volatile nature of DOGE.
Decoding market patterns and unlocking profitable trading strategies in the crypto space
Latest Articles
Stay ahead of the market.
Get curated U.S. market news, insights and key dates delivered to your inbox.


Comments
No comments yet