
Market Overview for DODO/Tether (DODOUSDT)
Summary
• Price surged from 0.0189 to 0.0203, forming bullish continuation patterns near key resistance.
• Momentum strengthened through the session, with RSI nearing overbought territory.
• Volatility expanded, with Bollinger Bands widening and price testing the upper band multiple times.
• Turnover spiked during the late-night rally, confirming bullish conviction.
• Volume surged during 00:00–06:00 ET, with a consolidation phase in the afternoon.
DODO/Tether (DODOUSDT) opened at 0.0189 (12:00 ET − 1), reached a high of 0.0203, and closed at 0.0198 by 12:00 ET. The pair traded between 0.0188 and 0.0203 during the period. Total volume amounted to 11,231,492.5, while turnover stood at 213,528.79.
Structure & Formations
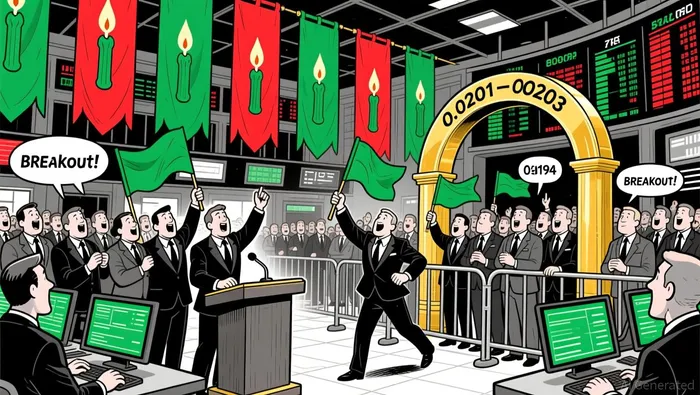
The 24-hour OHLCV data shows a strong bullish bias, with price forming several engulfing patterns after breaking above 0.0194. Key support levels emerged at 0.0193–0.0194, with resistance at 0.0201–0.0203 showing consolidation. A bearish doji appeared in the late afternoon, suggesting potential profit-taking, but the overall trend remains intact.
Moving Averages and MACD
A 20-period MA on the 5-minute chart crossed above the 50-period MA during the late-night rally, confirming a bullish crossover. MACD remained positive for much of the session, with the histogram expanding during the 00:00–04:00 ET window, indicating growing momentum.
RSI and Bollinger Bands
RSI reached 68–70 in the early morning before consolidating, suggesting the market is near overbought territory but not yet at a turning point. Bollinger Bands expanded significantly during the rally, with price repeatedly testing the upper band before pulling back, indicating strong but not overextended bullish sentiment.
Volume and Turnover
Volume surged from 217,252.5 at 00:00 ET to over 2.1 million at 03:45 ET, coinciding with the breakout from 0.0196–0.0201. Turnover closely followed the same trajectory, confirming the strength of the move. After 06:00 ET, volume began to wane, suggesting a potential pause in the rally.
Fibonacci Retracements
Applying Fibonacci levels to the recent 5-minute swing (0.0188–0.0203), the 61.8% retracement level is at 0.0196–0.0198, where price found temporary support. On the daily timeframe, a larger 38.2% retracement level at 0.0201 also saw activity, reinforcing its role as a key psychological threshold.
DODO/Tether may continue to test 0.0203–0.0205 in the next 24 hours, with a consolidation phase likely if the 0.0198–0.0201 range holds. A breakdown below 0.0194 could trigger renewed volatility and a retest of earlier supports. Investors should monitor volume and RSI levels for signs of exhaustion or follow-through.
Decoding market patterns and unlocking profitable trading strategies in the crypto space
Latest Articles
Stay ahead of the market.
Get curated U.S. market news, insights and key dates delivered to your inbox.


Comments
No comments yet