
Market Overview for DeXe/Tether (DEXEUSDT) on 2025-12-31
Summary
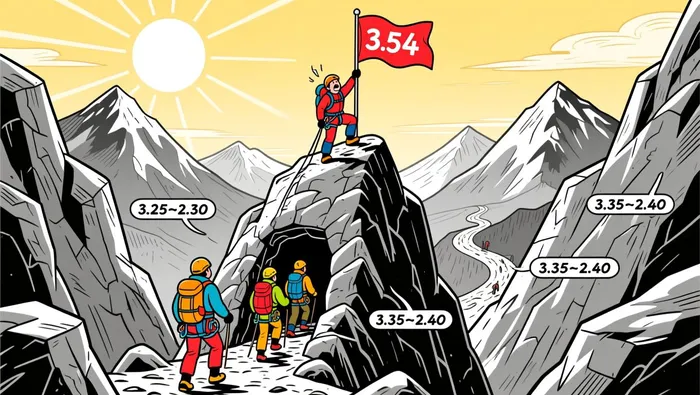
• Price surged past 3.25–3.40 resistance cluster on increasing volume.
• RSI crossed into overbought territory, suggesting short-term exhaustion.
• Bollinger Bands showed strong expansion, signaling heightened volatility.
• Volume confirmed the breakout, with no major divergence.
• Fibonacci retracement at 61.8% level aligned with key resistance around 3.31–3.35.
At 12:00 ET–1, DeXe/Tether (DEXEUSDT) opened at 3.083, hit a high of 3.54, a low of 3.061, and closed at 3.387. Total volume for the 24-hour window was 316,288.49 units, with a notional turnover of approximately $103,189.60.
Structure & Formations
Price action on the 5-minute chart showed a strong bullish breakout from a consolidation range between 3.10–3.25. Key resistance levels at 3.25–3.30 and 3.35–3.40 were pierced sequentially, with a high at 3.54 marking a new short-term peak. A bullish engulfing pattern formed at 3.25–3.30, which was confirmed by strong volume. A potential bearish doji appeared near 3.40, signaling a possible pause in the uptrend.
Moving Averages
On the 5-minute chart, the 20-period and 50-period moving averages were in strong bullish alignment, supporting the upward trend. Daily moving averages (50, 100, 200) suggested a longer-term bullish bias as price remained above the 200-day line.
Momentum Indicators
MACD showed a strong bullish crossover, reinforcing the recent breakout. RSI pushed into overbought territory, reaching over 75, which may indicate short-term pullback risk.
Bollinger Bands
Bollinger Bands widened significantly during the breakout phase, reflecting increased volatility. Price remained near the upper band at the close, suggesting continued bullish momentum.
Volume and Turnover
Volume surged during the breakout above 3.25–3.30, confirming the price action. The largest 5-minute volume spike occurred at 14:15 ET with $248,147 in turnover, coinciding with the breakout above 3.40. Turnover and volume remained aligned, indicating strong conviction in the move.
Fibonacci Retracements
Fibonacci retracement levels applied to the recent 5-minute swing (3.061–3.54) showed key support and resistance at 3.31 (61.8%) and 3.25 (50%). Price found short-term resistance at 3.31–3.35 before rallying to 3.54, suggesting further testing of these levels is likely.
Looking ahead, price may consolidate near current levels or attempt a test of the 3.50–3.55 range. Traders should be cautious of potential pullbacks due to the overbought RSI and the large move into overextended territory.
Decoding market patterns and unlocking profitable trading strategies in the crypto space
Latest Articles
Stay ahead of the market.
Get curated U.S. market news, insights and key dates delivered to your inbox.


Comments
No comments yet