
Market Overview for Decred/Tether (DCRUSDT): Volatility-Driven Recovery and Diverging Momentum
Summary
• Price surged from $25.51 to $29.87, forming bullish continuation and bearish reversal patterns.
• Momentum accelerated with RSI near overbought levels and expanding Bollinger Bands.
• Volume spiked during sharp rallies, confirming strength in key resistance breaks.
• 20-period MA supported the rally, with 50-period MA turning upward mid-day.
• Fibonacci retracement levels at $26.80 and $28.41 acted as key pivot points.
Decred/Tether (DCRUSDT) opened at $25.51 on 2026-01-15 12:00 ET and closed at $25.98 by 12:00 ET the following day. The pair reached a high of $29.87 and a low of $25.01, with total trading volume of 114,875.21 DCR and turnover of $3,053,457.82 over 24 hours.
Price initially declined sharply into the early hours of January 16, testing key support levels before reversing strongly from $25.01. A powerful rally followed, breaking through $28.00, with volume surging during the $27.00–$29.87 move. 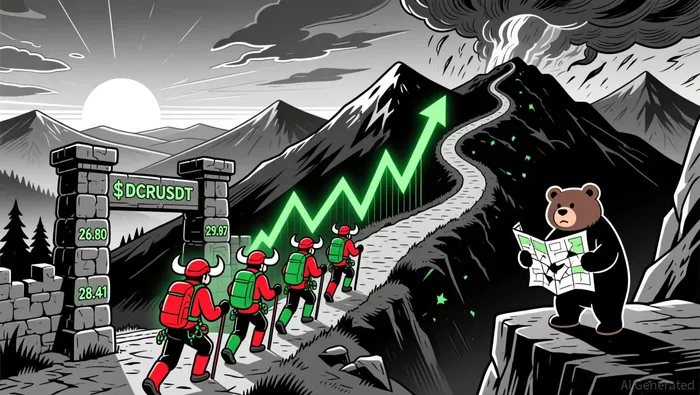 The 20-period moving average trended upward after 02:30 ET, while the 50-period MA also turned bullish.
MACD lines showed positive divergence during the recovery, indicating growing momentum. However, RSI approached overbought territory in the morning, suggesting potential consolidation. Bollinger Bands widened significantly during the rally, reflecting increased volatility. A large bullish engulfing pattern formed around 02:45 ET, followed by a potential bearish harami near $29.87, hinting at uncertainty in the short-term direction.
Fibonacci retracement levels at 38.2% ($26.80) and 61.8% ($28.41) provided key resistance, both of which were breached during the rally. Volume surged during these breaks, particularly on the $28.41–$29.87 leg, suggesting strong conviction behind the move.
The market appears to be entering a phase of consolidation after the sharp move higher. Investors may watch for a retest of the $26.35–$27.00 range as potential support. However, divergences in RSI and the bearish harami pattern suggest caution ahead. A pullback into that range could offer a more defined entry, but further volatility is likely depending on broader macro and crypto sentiment.
Decoding market patterns and unlocking profitable trading strategies in the crypto space
Latest Articles
Stay ahead of the market.
Get curated U.S. market news, insights and key dates delivered to your inbox.

AInvest
PRO
AInvest
PRO
Comments
No comments yet