
Market Overview: Decentraland/Tether (MANAUSDT) on 2025-12-12


Summary
• Price surged to $0.1515 before consolidating near $0.1497, showing strong short-term bullish momentum.
• A key 5-minute bullish engulfing pattern formed at $0.1495, reinforcing potential upward continuation.
• RSI remains neutral at ~52, while volume has increased notably during the rally phase.
• A descending triangle formed between $0.1482 and $0.1515, suggesting a likely breakout in the near term.
• Bollinger Bands show moderate volatility, with price hovering near the upper band at multiple points.
Decentraland/Tether (MANAUSDT) opened at $0.1462 on 2025-12-11 12:00 ET, surged to a high of $0.1515, and closed at $0.1497 as of 2025-12-12 12:00 ET. The 24-hour volume amounted to 5,346,455.0 units, with a total notional turnover of $765,429.
Structure & Key Levels
Price formed a descending triangle between $0.1482 and $0.1515, suggesting a potential breakout to the upside if resistance at $0.1515 is retested with conviction. A bullish engulfing pattern on the 5-minute chart at $0.1495 indicates strong buying pressure. The 20- and 50-period moving averages on the 5-minute chart show a bullish crossover, reinforcing short-term momentum.
Momentum & Volatility
The 5-minute MACD has shown a positive crossover and remains above zero, indicating continued bullish momentum. The RSI remains in the neutral range around 52, suggesting no overbought or oversold conditions at the close. Bollinger Bands show moderate volatility with price staying near the upper band during key rallies, particularly between 21:00 and 07:00 ET.
Volume & Turnover Dynamics
Trading volume surged to over 538,340 units at 01:00 ET, coinciding with a sharp pullback to $0.1482. The rally to $0.1515 was supported by a 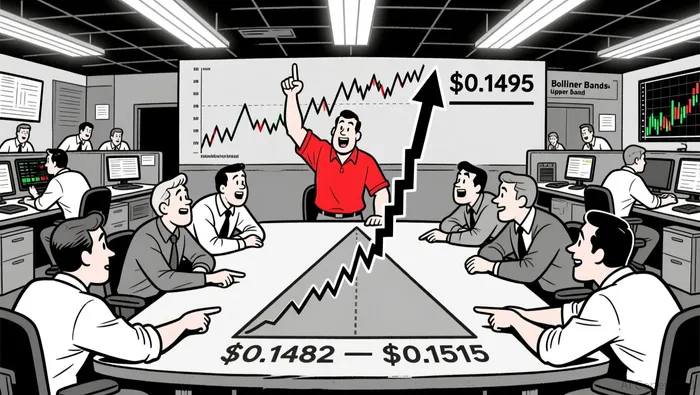 consistent volume increase, suggesting healthy participation. Notional turnover rose above $7.65M, confirming the strength of recent moves. Divergences were not observed between price and turnover, suggesting strong alignment in market sentiment.
Fibonacci Retracement Levels
A key 5-minute swing from $0.1462 to $0.1515 has seen price stall at the 61.8% retracement level around $0.1497, which now appears to be acting as a consolidation zone. Daily Fibonacci levels suggest potential support near $0.145 and $0.1427, with resistance likely at $0.1515 and $0.1537.
Price may test the upper triangle boundary at $0.1515 in the next 24 hours, with a potential pullback to the $0.1482–$0.1497 range if buyers fail to commit. Investors should remain cautious of a retracement if volume declines significantly after a breakout attempt.
Decoding market patterns and unlocking profitable trading strategies in the crypto space
Latest Articles
Stay ahead of the market.
Get curated U.S. market news, insights and key dates delivered to your inbox.

AInvest
PRO
AInvest
PRO
Comments
No comments yet