
Market Overview for Dash/Tether (DASHUSDT)


Summary
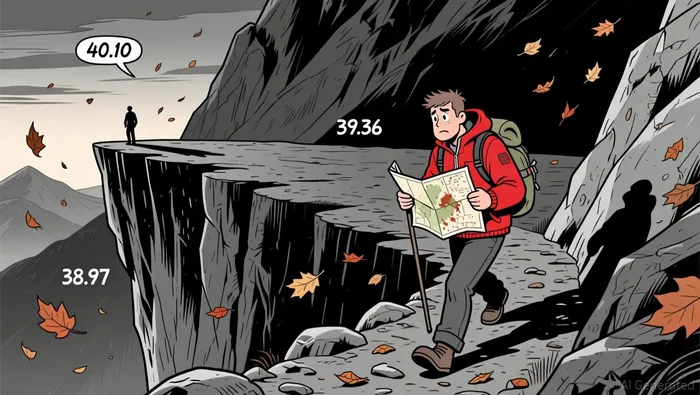
• DASHUSDTDASH-- formed a key bearish reversal pattern at 40.10 after strong intraday rally.
• Volume surged during early morning consolidation but diverged with price weakness.
• RSI entered oversold territory near 30, suggesting possible near-term bounce.
• Price tested 38.97 support twice, with a break below 38.60 threatening 37.90.
• Volatility expanded as Bollinger Bands widened, indicating increased market uncertainty.
At 12:00 ET on 2025-12-21, Dash/Tether (DASHUSDT) opened at 39.36, reaching a high of 40.32 and a low of 37.80 before closing at 38.81. Total volume stood at 103,393.51 DASH, with $3,944,451.09 in turnover over 24 hours.
Structure & Formations
Price formed a bearish engulfing pattern at 40.10 during the early morning before failing to reclaim key resistance. The 38.97 level acted as immediate support, with a breakdown below 38.60 suggesting further bearish pressure. A doji formed near 39.36, hinting at indecision in the 39.10–39.40 range.
Moving Averages
The 20-period 5-minute MA showed bearish divergence as it crossed below a key resistance level near 39.85. Daily MAs (50/100/200) remained unbroken, but a sharp intraday pullback has increased the risk of a 50-day MA crossover.
MACD & RSI
The MACD histogram shrank in the negative territory during the afternoon, signaling waning bearish momentum. RSI reached 29.8, near oversold conditions, suggesting a short-term bounce may be likely but not confirming a reversal.
Bollinger Bands
Price action broke out of a tight Bollinger Band contraction early in the session, leading to a sharp expansion. DASHUSDT now trades near the lower band, indicating heightened volatility and elevated downside risk.
Volume & Turnover
Volume spiked during the intraday reversal phase but failed to confirm bullish strength as turnover declined. A divergence between volume and price emerged after 06:00 ET, with lower turnover accompanying the selloff.
Fibonacci Retracements
The 38.2% Fibonacci level at 39.25 and 61.8% at 38.90 acted as temporary pivots. A breakdown below 38.60 would expose the 37.90 level, the 61.8% retracement from the recent high of 40.32.
The market appears poised for a short-term bounce from oversold RSI levels, but key support at 38.97 remains under pressure. A sustained break below 38.60 could accelerate the move toward 37.90. Investors should monitor volume for confirmation of any reversal.
Decoding market patterns and unlocking profitable trading strategies in the crypto space
Latest Articles
Stay ahead of the market.
Get curated U.S. market news, insights and key dates delivered to your inbox.


Comments
No comments yet