
Market Overview: Chainlink/Tether (LINKUSDT) on 2025-12-25
Summary
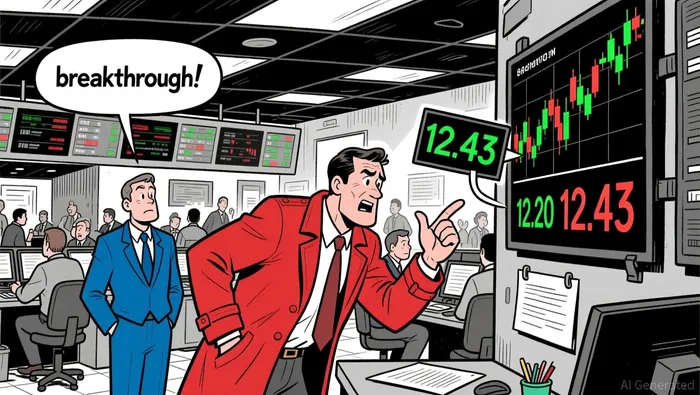
• Price tested key resistance near $12.43 before consolidating within a descending triangle.
• Momentum remained positive with RSI peaking near overbought but not oversold, suggesting strong bullish bias.
• Volume surged during the breakout attempt but faded during consolidation, hinting at potential exhaustion.
• Bollinger Bands tightened mid-session, signaling possible volatility ahead; price closed near the upper band.
• Fibonacci retracements identified a 61.8% level at $12.30 as initial support ahead of $12.20.
Market Overview
Chainlink/Tether (LINKUSDT) opened at $12.20 on 2025-12-24 at 12:00 ET, reached a high of $12.43, a low of $12.11, and closed at $12.20 on 2025-12-25 at 12:00 ET. Total volume was 501,876.03 and notional turnover amounted to $6.14 million over 24 hours.
Structure & Key Levels
Price action formed a descending triangle with resistance around $12.43 and support near $12.20. A bullish engulfing pattern emerged during the post-breakout pullback near $12.20, suggesting potential reversal. A long-legged doji at $12.41 signaled indecision after the high of the day.
Technical Indicators
 The 20- and 50-period moving averages on the 5-minute chart converged slightly bearish in the morning before shifting into bullish alignment later in the session. The RSI surged to 75, indicating overbought conditions, though it did not cross into extreme levels. MACD showed a positive divergence in the afternoon as price corrected but momentum held.
 Bollinger Bands contracted mid-day and expanded after the breakout, with price closing near the upper band, signaling elevated volatility. On the daily chart, the 200-period moving average is a critical long-term support at ~$12.10.
Volume and Turnover
Volume spiked to over 45,000 units during the breakout to $12.43, confirming strength. However, volume decreased significantly during consolidation, indicating a potential lack of follow-through. Turnover closely aligned with volume patterns, with a peak of $575,000 at $12.41. No major price-volume divergence was observed, suggesting price action is still supported by liquidity.
Fibonacci Retracements
On the 5-minute chart, Fibonacci levels from the $12.11 to $12.43 swing showed key support at 61.8% ($12.30) and 38.2% ($12.36). Daily retracements from the recent high to low indicated support at $12.20 and resistance at $12.43.
Forward-Looking Outlook
While price has tested and retested $12.43 without breaking through decisively, the presence of strong bullish momentum and volume suggests a potential breakout attempt in the next 24 hours. Traders should monitor the $12.43 resistance and $12.20 support levels for potential direction. A breakdown below $12.20 could reintroduce bearish pressure, while a confirmed break above $12.43 may attract further buying interest.
Descifrar los patrones del mercado y desarrollar estrategias de trading rentables en el ámbito de las criptomonedas.
Latest Articles
Stay ahead of the market.
Get curated U.S. market news, insights and key dates delivered to your inbox.


Comments
No comments yet