
Market Overview: Celestia/Tether (TIAUSDT) — 24-Hour Summary


Summary
• TIAUSDT formed key support near $0.501 and a resistance cluster around $0.515 on 5-minute charts.
• Momentum slowed after a morning rally, with RSI approaching overbought levels but lacking follow-through.
• Volatility expanded mid-day as Bollinger Bands widened, but price retracted toward the lower band by close.
• Volume surged during the 08:00–09:00 ET window, confirming a rebound but diverging from later price weakness.
• Fibonacci retracements suggest a potential bounce from 0.501–0.504 levels, with 0.511 as a key near-term target.
Celestia/Tether (TIAUSDT) opened at $0.514 on 12/15, reached a high of $0.516, and closed at $0.514 as of 12:00 ET on 12/16. The pair found support near $0.501 and tested resistance at $0.515 throughout the session. Total traded volume reached 11.5 million TIA, with notional turnover of approximately $5.85 million over 24 hours.
Structure & Formations
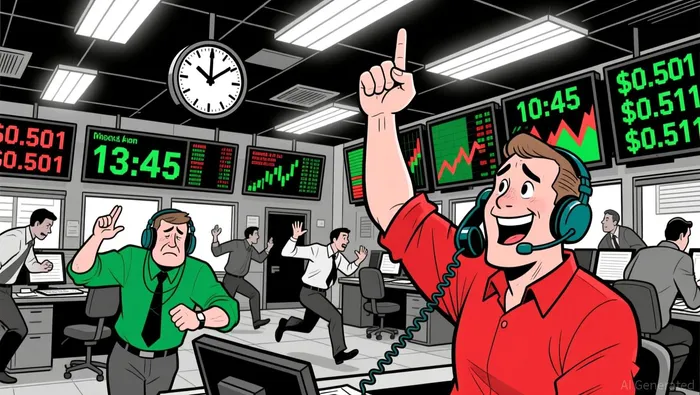
The 5-minute chart showed a bullish engulfing pattern at 10:45 ET as TIAUSDT reversed from $0.502 to $0.511, followed by a larger bearish engulfing pattern at 13:45 ET that pushed prices back below $0.510.
 A key support zone formed around $0.501–$0.504 after a late-morning breakdown, with a 61.8% Fibonacci retracement at $0.511 likely to act as a pivot level for the next 24 hours.
Indicators & Momentum
The 20-period and 50-period moving averages on the 5-minute chart converged near $0.508–$0.510, suggesting short-term equilibrium. RSI edged into overbought territory in the afternoon but failed to sustain above 60, indicating potential exhaustion in the bullish move. MACD lines flattened in the evening, pointing to waning momentum.
Volatility & Divergences
Bollinger Bands expanded significantly between 08:00–10:00 ET as volatility surged, but prices subsequently consolidated closer to the lower band. Notional turnover spiked during the 08:00–09:00 ET window, confirming a short-term rebound, yet volume failed to support the same strength in the latter half of the day, hinting at fading conviction.
Forward-Looking View
TIAUSDT appears to be positioning for a test of the $0.515–$0.516 resistance cluster, though a failure to close above $0.514 in the next 24 hours could trigger a pullback toward $0.505–$0.506. Investors should remain cautious of potential divergence between volume and price action, especially around key Fib levels.
Descifrar los patrones del mercado y desarrollar estrategias de trading rentables en el sector de las criptomonedas.
Latest Articles
Stay ahead of the market.
Get curated U.S. market news, insights and key dates delivered to your inbox.


Comments
No comments yet