
Market Overview for Cardano/Tether (ADAUSDT)
Summary
• ADAUSDT tested key support near $0.462–0.464, rebounding with bullish reversal cues.
• Volatility expanded in morning ET, with a volume spike aligning with price rejection.
• RSI moved out of oversold territory, suggesting momentum could stabilize above 0.465.
Market Overview
Cardano/Tether (ADAUSDT) opened at $0.4766 on 2025-12-09 at 12:00 ET and closed at $0.4657 on 2025-12-10 at 12:00 ET, reaching a high of $0.4832 and a low of $0.4613 over the 24-hour period. Total volume traded was 107.2 million ADAADA--, with a notional turnover of approximately $49.5 million.
Structure & Formations
Price found a potential short-term support zone between $0.462 and $0.464, where multiple 5-minute bullish reversal patterns formed after a sharp decline. A key resistance appears at $0.473–0.475, where prior bearish divergence occurred.
Moving Averages
The 5-minute 20-period and 50-period moving averages trended lower throughout the session, indicating bearish pressure. Daily MAs suggest further bearish alignment, with the 50-period likely below the 100-period.
Momentum & Volatility
Relative Strength Index (RSI) briefly entered oversold territory below 30 before bouncing, signaling potential stabilizing momentum. Bollinger Bands showed a recent expansion, confirming increased volatility in the morning ET session.
Volume and Turnover
Volume surged during the sharp decline below $0.468, confirming bearish sentiment. Turnover matched volume spikes during the key support test and rebound, suggesting conviction behind the rebound.
Fibonacci Retracements
On the 5-minute chart, price appears to have found support near the 61.8% Fibonacci retracement level of the prior $0.462–$0.4832 move. Further downside could target the 78.6% retracement at ~$0.458 if short-term bearish momentum continues.
ADAUSDT appears to be stabilizing above $0.465, with potential for a short-term bullish bounce if it holds. 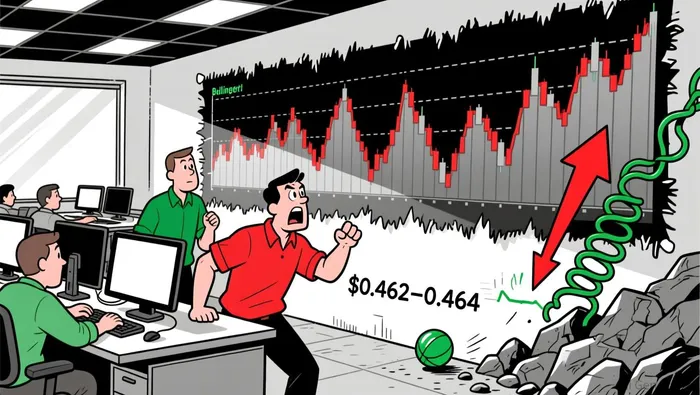 However, the path remains bearish in the broader context, and a close below $0.462 could signal renewed weakness. Investors should watch for confirmation above $0.470 for a more definitive shift in sentiment.
Descifrar los patrones del mercado y desarrollar estrategias de negociación rentables en el ámbito de las criptomonedas.
Latest Articles
Stay ahead of the market.
Get curated U.S. market news, insights and key dates delivered to your inbox.


Comments
No comments yet