
Market Overview: BounceBit/BNB (BBBNB) 24-Hour Summary
Summary
• Price fluctuated between 7.16e-05 and 7.44e-05, forming a bearish engulfing pattern near the session high.
• Volume spiked during the 0345-0445 ET window but failed to confirm a strong trend.
• RSI hovered around 50, suggesting a lack of directional bias but no clear overbought or oversold signals.
BounceBit/BNB (BBBNB) opened at 7.29e-05 on 2026-01-05 12:00 ET, reached a high of 7.44e-05, and a low of 7.16e-05, closing at 7.32e-05 on 2026-01-06 12:00 ET. Total volume was 767,936.5, with a notional turnover of 54.799846.
Structure & Formations
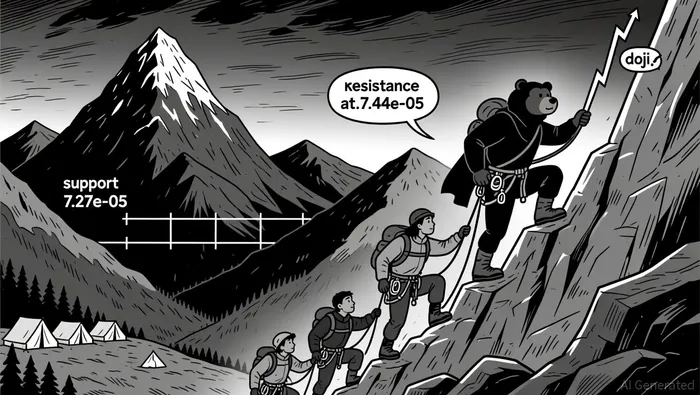
The price formed a bearish engulfing pattern near the 7.39e-05 level, hinting at potential near-term reversal. Key support appears at 7.31e-05 and 7.27e-05, while resistance is forming at 7.41e-05 and 7.44e-05. A doji appeared near 7.39e-05, signaling indecision.
Volatility and Moving Averages
Bollinger Bands expanded during the 0345-0445 ET period, suggesting increased volatility. The 20-period 5-minute moving average dipped below the 50-period line, indicating a short-term bearish bias, though the 50/100/200 daily MA lines remain aligned, suggesting no clear break in the longer-term trend.
Momentum and Divergence
MACD remained near the zero line, reflecting weak momentum. RSI hovered around 50, showing no signs of overbought or oversold conditions. A volume divergence was noted during the 0200-0400 ET window, where price made a high but volume declined, suggesting potential exhaustion in the bullish move.
Volume and Turnover
Trading volume peaked around 0345-0445 ET with a large 5-minute bar pushing price from 7.33e-05 to 7.41e-05. However, turnover failed to confirm the strength of the move, raising questions about the sustainability of the upward thrust.
Looking ahead, the price may test the 7.31e-05 support level or attempt a breakout above 7.41e-05. Traders should remain cautious as divergence in volume and indecisive candlestick patterns suggest the market could remain range-bound or volatile in the next 24 hours.
Decoding market patterns and unlocking profitable trading strategies in the crypto space
Latest Articles
Stay ahead of the market.
Get curated U.S. market news, insights and key dates delivered to your inbox.


Comments
No comments yet