
Market Overview for BNB/Yen (BNBJPY) – January 16, 2026
Summary
• BNB/Yen fell 0.5% in 24 hours, forming bearish patterns on the 5-minute chart.
• RSI and MACD indicated weakening momentum with oversold conditions near 30.
• Volatility expanded with a Bollinger Band squeeze followed by a break.
• Volume surged during the decline, confirming bearish sentiment.
• Fibonacci retracement levels showed key support near 147,800.
BNB/Yen opened at 148,714 Yen on 2026-01-15 12:00 ET and closed at 148,111 Yen on 2026-01-16 12:00 ET, with a high of 149,472 and a low of 146,868. Total volume traded was 498.0917 BNB, and notional turnover reached 71,392,826.89 Yen.
Structure & Formations
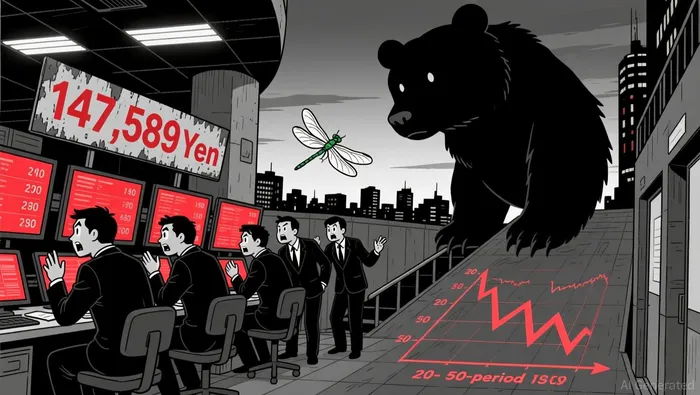
Price action showed a bearish engulfing pattern in the early session, followed by a consolidation phase with a doji near 147,589. Key support levels emerged around 147,300–147,700, with 146,900 as a critical floor.
Moving Averages and Momentum
The 20-period and 50-period moving averages on the 5-minute chart remained bearish, with price consistently below both. The 50-period daily MA sits just above 148,000, suggesting short-term support. RSI approached 30, indicating oversold conditions, while MACD showed bearish divergence.
Bollinger Bands and Volatility
Volatility expanded after a brief contraction in the early morning, with price breaking the lower Bollinger Band at around 147,700. This expansion suggests increasing short-term uncertainty and potential for a bounce.
Volume and Turnover
Volume spiked during the sharp decline between 19:15 and 20:30 ET, confirming bearish pressure. Turnover also rose in alignment with falling prices, showing no signs of divergence between volume and price.
Fibonacci Retracements
Fib levels drawn from the 5-minute swing high at 149,472 and the low at 146,868 suggest 147,800 (38.2%) as a near-term support level. A break below 147,300 would target 146,900 (61.8%).
Forward-looking, a retest of 147,800–147,300 appears likely, with potential for a rebound if RSI recovers above 35. However, a break below 146,900 could reignite the bear trend. Investors should remain cautious due to the fragile balance between support levels and bearish momentum.
Decoding market patterns and unlocking profitable trading strategies in the crypto space
Latest Articles
Stay ahead of the market.
Get curated U.S. market news, insights and key dates delivered to your inbox.

AInvest
PRO
AInvest
PRO
Comments
No comments yet