
Market Overview for Bitcoin/Tether (BTCUSDT)
Summary
• Bitcoin/Tether tested key support levels, forming bearish engulfing patterns.
• Volatility expanded with price breaking below 20-period moving average.
• RSI and MACD signaled weakening momentum, suggesting potential for oversold conditions.
• High volume divergence flagged bearish conviction late in the session.
• Bollinger Bands contraction preceded a sharp 5-minute price drop below the midline.
Bitcoin/Tether (BTCUSDT) opened at $91,331.39 on January 9 at 12:00 ET and closed at $90,723.87 by 12:00 ET on January 10. The pair reached a high of $91,680.41 and a low of $90,300.00, with a 24-hour trading volume of 2,848.08 BTC and a notional turnover of $256,973,723.81.
Structure & Formations
The 5-minute chart displayed a bearish engulfing pattern near the $91,623.88 close of the first candle, suggesting a shift in momentum to the downside. A significant breakdown below $90,600.00 followed a bearish flag pattern, reinforcing short-term bearish bias.
Moving Averages
Price closed below the 20-period and 50-period moving averages on the 5-minute chart, signaling a potential continuation of downward momentum. The daily 50-period SMA is approaching $90,750.00, which may serve as a near-term support target.
MACD & RSI
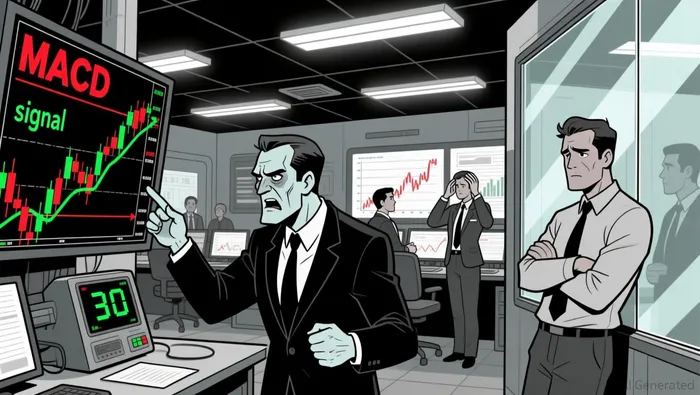
The MACD crossed below the signal line, confirming bearish momentum. RSI dipped into oversold territory near 30 late in the session, hinting at potential consolidation or a short-term rebound.
Bollinger Bands
Price action saw a contraction in Bollinger Bands before a sharp 5-minute drop, with BTCUSDTBTC-- finishing near the lower band at $90,723.87. This suggests heightened volatility and potential for a bounce or continuation of the downtrend.
Volume & Turnover
Volume surged after 18:30 ET on January 9, with a large 5-minute candle closing at $90,603.52 on strong volume. Notional turnover peaked at $17,280,613.36 during this period, confirming bearish conviction.
Fibonacci Retracements
Recent 5-minute swings saw price dipping to the 61.8% Fibonacci level at $90,600.00 before rebounding. Daily retracement levels suggest $90,200.00 and $89,600.00 as key support areas.
Market participants may watch for a test of $90,500.00 as a potential near-term floor. A break below $90,200.00 could accelerate further selling. Investors should remain cautious as volatility remains elevated and divergences suggest mixed sentiment ahead.
Decoding market patterns and unlocking profitable trading strategies in the crypto space
Latest Articles
Stay ahead of the market.
Get curated U.S. market news, insights and key dates delivered to your inbox.


Comments
No comments yet