
Market Overview for Bitcoin/Tether on 2025-12-28
Summary
• Price tested key support near $87,600 before rebounding with bullish momentum.
• Volume and turnover aligned with price lows, suggesting strong accumulation.
• MACD turned neutral while RSI hovered near 50, indicating balanced market sentiment.
• Bollinger Bands showed moderate volatility with price clustering near the midline.
• A bearish engulfing pattern appeared at the session high, hinting at potential near-term resistance.
Bitcoin/Tether (BTCUSDT) opened at $87,877 on 2025-12-27 12:00 ET, peaked at $88,088.75, and closed at $87,821.13 on 2025-12-28 12:00 ET, with a low of $87,614.79. Total volume was 1,247.35 BTC, and notional turnover amounted to $109.16 million over the 24-hour window.
Structure & Formations
Price action formed a key support cluster around $87,600–$87,700, where buyers stepped in multiple times. A bearish engulfing candle appeared on the $88,000–$87,900 swing, suggesting resistance. A doji formed at $87,740, indicating indecision during consolidation.
Moving Averages
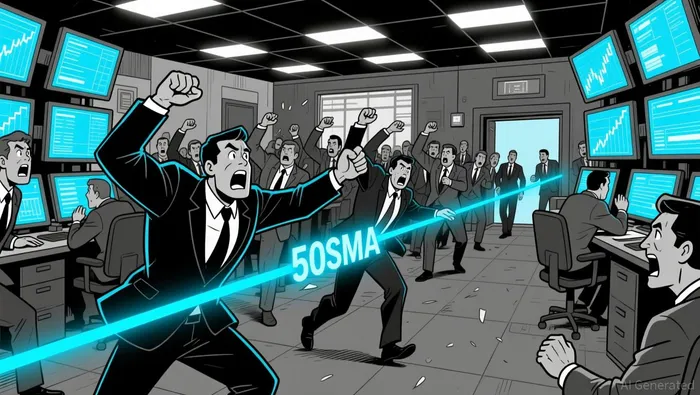 The 5-minute chart showed price fluctuating between the 20-period and 50-period SMAs, with the 50SMA at $87,830 providing a dynamic support level. On the daily chart, BTCUSDTBTC-- closed above the 50-day SMA but below the 200-day SMA, suggesting mixed-term positioning.
MACD & RSI
MACD showed a narrow histogram with a neutral crossover, indicating waning momentum. RSI hovered near the 50 level, suggesting a balanced market without clear overbought or oversold conditions, though a slight bearish divergence appeared during the afternoon rally.
Bollinger Bands
Volatility remained moderate, with Bollinger Bands expanding slightly during the late morning and early afternoon. Price spent much of the session near the midline, suggesting a consolidation phase, with no significant breakouts observed.
Volume & Turnover
Volume and turnover were highest between 10:45–11:45 ET, coinciding with the $87,700–$87,900 price range. A divergence was noted as volume decreased during the late-day rally to $87,918.23, hinting at waning follow-through.
Fibonacci Retracements
A key 5-minute retracement level at 61.8% (~$87,840) held as support. On the daily chart, the 38.2% retracement level (~$88,000) served as resistance, where price repeatedly stalled.
Bitcoin/Tether may testTST-- $87,600 support again in the next 24 hours or retest $88,000 for a potential breakout. Investors should watch for divergences in volume and RSI as early signals of trend reversal.
Decoding market patterns and unlocking profitable trading strategies in the crypto space
Latest Articles
Stay ahead of the market.
Get curated U.S. market news, insights and key dates delivered to your inbox.


Comments
No comments yet