
Market Overview for Bio Protocol/Tether (BIOUSDT)
Summary
• Price surged from 0.0443 to 0.0475 on 5-minute chart, breaking above prior resistance.
• RSI and MACD both show bullish momentum, with RSI near overbought territory.
• Volume spiked in the afternoon ET, confirming price strength.
• Bollinger Bands expanded significantly, indicating heightened volatility.
• A bullish engulfing pattern formed near the 0.0466 level, supporting further upside.
At 12:00 ET on 2026-01-14, Bio Protocol/Tether (BIOUSDT) opened at 0.0443, surged to a 24-hour high of 0.0476, and closed at 0.0470. The pair found support near 0.0442 and resistance at 0.0468–0.0472. Total volume reached 45.54 million, with turnover hitting $2.22 million, reflecting increased participation and buying pressure.
Structure & Formations
Key resistance levels appear at 0.0468–0.0472 and 0.0475–0.0476, while immediate support is at 0.0465 and 0.0462. A bullish engulfing pattern formed near 0.0466, suggesting short-term bullish potential. A potential 50% Fibonacci retracement of the 0.0443 to 0.0476 move aligns with 0.0459, which was briefly tested.
Moving Averages
On the 5-minute chart, the 20-period MA crossed above the 50-period MA, signaling a potential short-term bullish bias. 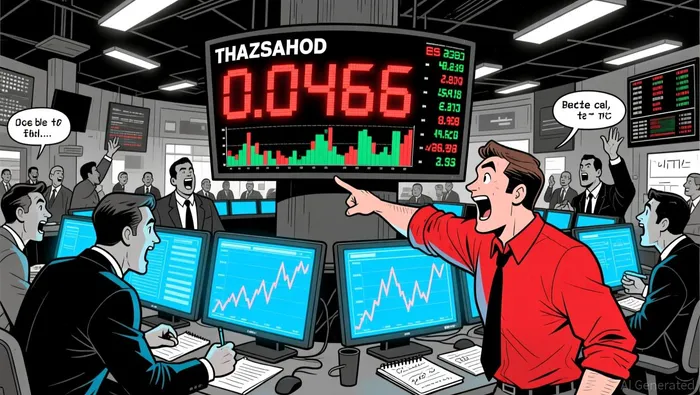 The price remains above both 50 and 200-period daily MAs, reinforcing the uptrend structure.
Momentum and Volatility
RSI climbed to near 70, indicating overbought conditions, and MACD crossed into positive territory with a strong histogram. Bollinger Bands widened in the late afternoon ET, highlighting increased volatility. Price has tested the upper band multiple times, indicating a volatile breakout phase.
Volume and Turnover
The largest volume spike occurred between 10:00 and 11:00 ET when the pair surged from 0.0463 to 0.0475. Turnover increased in line with the price advance, supporting the move as genuine demand-driven. No major divergence was observed between price and volume.
Forward Outlook and Risk
If 0.0472–0.0475 can be sustained, the next potential target may be 0.0478–0.0480. However, a close below 0.0465 could signal a pullback. Investors should watch for a potential test of the 50-period daily MA at ~0.0460 as a near-term support.
Descifrar patrones de mercado y desarrollar estrategias de trading rentables en el sector cripto.
Latest Articles
Stay ahead of the market.
Get curated U.S. market news, insights and key dates delivered to your inbox.


Comments
No comments yet