
Market Overview for Binance Staked SOL/Solana (BNSOLSOL)
Summary
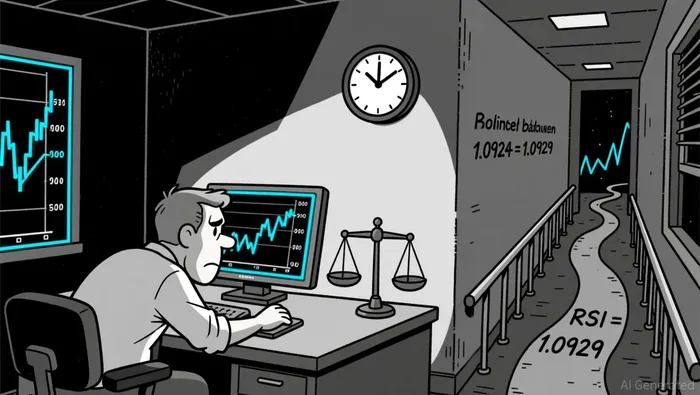
• Price consolidation near 1.0924–1.0929 range with no decisive breakout.
• Volatility remains subdued, with Bollinger Bands showing slight contraction.
• RSI near 50 suggests neutral momentum, with no overbought or oversold signals.
• Volume spiked during the overnight session, but price failed to follow through.
• A bullish engulfing pattern failed to hold, suggesting bearish pressure remains intact.
Binance Staked SOL/Solana (BNSOLSOL) opened at 1.0924 on 2026-01-11 at 12:00 ET, reaching a high of 1.0929 and a low of 1.0919 before closing at 1.0928 on 2026-01-12 at 12:00 ET. Total volume for the 24-hour period was approximately 14,400.171 units, with notional turnover of ~15,721.99.
Structure & Formations
Price remained in a tight range around 1.0924–1.0929, with several failed attempts to break above 1.0929. The consolidation suggests indecision among traders. A potential support zone appears to form near 1.0922, which held during two 5-minute intervals but was tested again overnight.
Moving Averages
On the 5-minute chart, the 20- and 50-period moving averages are closely aligned, indicating a flat trend. On the daily chart, the 50- and 200-period moving averages have not crossed, suggesting a lack of major directional bias.
MACD & RSI
The RSI hovered near 50 throughout the 24-hour window, indicating neutral momentum and no signs of overbought or oversold conditions. The MACD line remained close to the signal line, with no clear divergence or bullish impulse.
Bollinger Bands
Volatility appeared to contract during the late-night hours, with the Bollinger Bands narrowing as price remained within a tight range. Price has shown no significant deviation from the middle band, indicating a lack of directional bias.
Volume & Turnover
Volume and turnover spiked during the overnight hours (01:30–02:30 ET), with large trades contributing to a temporary pullback from the upper range. However, the price failed to maintain gains from this activity, suggesting limited conviction.
Fibonacci Retracements
Applying Fibonacci to recent 5-minute swings, 1.0924 and 1.0929 represent key 61.8% and 38.2% retracement levels, respectively. Price has bounced off these levels multiple times, suggesting they may act as barriers to further movement.
With price consolidating and volume declining, it appears likely that the market is waiting for a catalyst to break the current range. Investors should remain cautious in the coming 24 hours, as a breakout attempt without follow-through volume may lead to a false move.
Decoding market patterns and unlocking profitable trading strategies in the crypto space
Latest Articles
Stay ahead of the market.
Get curated U.S. market news, insights and key dates delivered to your inbox.

AInvest
PRO
AInvest
PRO
Comments
No comments yet