
Market Overview for Beefy/Tether (BIFIUSDT)


Summary
• BIFIUSDT climbed from $108.9 to $111.6, forming a bullish engulfing pattern near $110.
• RSI surged to 68, signaling rising momentum without overbought levels.
• Volatility expanded during the 5-hour window from 00:00 to 05:00 ET, with peak at $111.6.
• Bollinger Bands widened as prices moved beyond the upper band, confirming upward bias.
• Volume surged at 00:00–02:00 ET, confirming strength in the upward move.
Beefy/Tether (BIFIUSDT) opened at $108.9 on December 11, touched a high of $111.6, a low of $108.9, and closed at $110.0 at 12:00 ET on December 12. Total volume reached 936.4, while turnover amounted to approximately $101,195 during the 24-hour window.
Structure & Formations
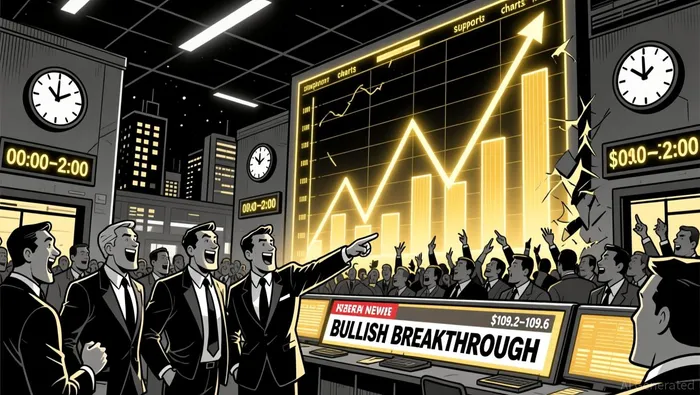
The 24-hour candlestick pattern shows a strong bullish bias. A key resistance level appears to form around $111.5–111.6, marked by a cluster of volume and a 5-minute high. A bullish engulfing pattern was observed around 21:30–21:45 ET as prices surged from $110.0 to $111.0, indicating strong buying pressure. A potential support level exists at $109.2–109.6, confirmed by a consolidation phase and a 5-minute reversal candle at 19:30–19:45 ET.
Moving Averages
On the 5-minute chart, the price closed above both the 20-period and 50-period moving averages, suggesting short-term bullish momentum. On the daily timeframe, a 50-period MA crossed above the 100-period MA, signaling a potential continuation of the uptrend.
Momentum and Volatility
The MACD showed a positive crossover at 00:00–02:00 ET, aligning with the price’s surge toward $111.6. RSI climbed from 55 to 68, indicating strong, but not overbought, momentum. Bollinger Bands expanded during the early hours of December 12, reflecting rising volatility. Price tested and briefly exceeded the upper band, reinforcing the bullish bias.
Volume and Turnover
Volume spiked to 24.174 at 04:00 ET and remained above average throughout the early morning session. Notable turnover spikes occurred at 00:00, 01:15, and 02:15 ET, confirming the strength of the upward move. A divergence in volume was noted at 08:00–09:00 ET as price pulled back without a corresponding drop in volume, suggesting possible continuation.
Fibonacci Retracements
On the 5-minute chart, the recent $108.9–$111.6 move saw price retrace to the 38.2% level at $110.1 and the 61.8% level at $110.9 before consolidating. These levels acted as dynamic support, with the 61.8% level seeing a bullish reversal candle at 22:45–23:00 ET.
BIFIUSDT appears to be in a short-to-midterm bullish phase, supported by strong volume and momentum. However, a pullback to test the 61.8% Fibonacci level at $110.9 could provide a clearer signal for near-term continuation. Investors should remain cautious of thin volume levels in the afternoon and potential volatility shifts overnight.
Descifrar patrones de mercado y desarrollar estrategias de trading rentables en el ámbito de las criptomonedas.
Latest Articles
Stay ahead of the market.
Get curated U.S. market news, insights and key dates delivered to your inbox.


Comments
No comments yet