
Market Overview for Basic Attention Token/Tether (BATUSDT)
Summary
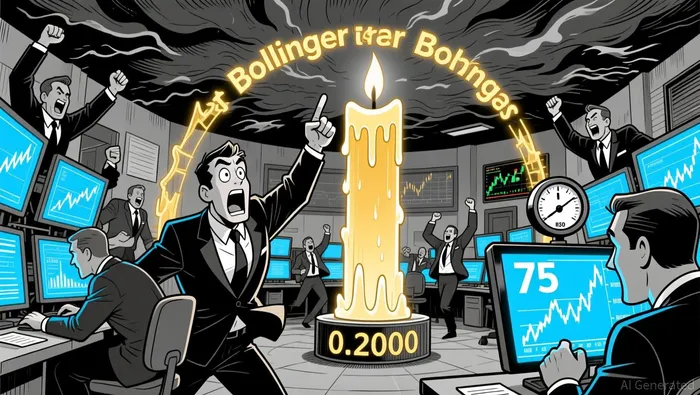
• Price surged from 0.1923 to 0.2191 on strong volume, forming a bullish reversal pattern after earlier consolidation.
• RSI reached overbought territory near 75, signaling possible near-term correction or consolidation.
• Volatility expanded significantly, with price moving beyond upper Bollinger Band as bullish momentum accelerated.
• Fibonacci retracement levels suggest potential pullback to 0.2080–0.2130 area ahead of key support.
• Turnover exceeded 500k BATT, confirming strong conviction in upward move during late ET hours.
Basic Attention Token/Tether (BATUSDT) opened at 0.1923 on 2026-01-16 12:00 ET, surged to a high of 0.2191, and closed at 0.2191 by 2026-01-17 12:00 ET. The 24-hour volume reached 12.35 million BATT with a notional turnover of 2.68 million USD.
Structure & Momentum
Price action showed a strong bullish reversal after a consolidation phase, with a breakout above key resistance levels. A large engulfing candle formed near 0.2000, followed by a series of higher highs and higher lows, confirming a shift in market sentiment.
Volatility and Indicators
Bollinger Bands widened significantly during the late ET hours, indicating a sharp increase in volatility. RSI climbed into overbought territory, reaching around 75, suggesting a potential pause in the rally. MACD crossed into positive territory and maintained a strong bullish divergence.
Volume and Turnover Analysis
Volume surged above 500k BATT during the final hours of the 24-hour window, confirming the strength of the rally. Turnover matched the volume increase, showing consistent buying pressure. However, divergence between price and volume was observed in the final 2 hours, indicating early signs of exhaustion.
Key Levels and Fibonacci Retracements
Fibonacci retracement levels from the key 0.1920–0.2191 swing suggest 0.2130 and 0.2080 as critical retracement zones. If buyers hold at these levels, the pair may continue testing higher resistance. The 0.1940 area remains a critical support level for a potential deeper pullback.
The market appears to be in a bullish momentum phase, but overbought conditions and divergences signal caution. Investors should watch for a pullback to the 0.2080–0.2130 range, with a risk of consolidation if Fibonacci support levels fail to hold.
Descifrar los patrones del mercado y desarrollar estrategias de negociación rentables en el ámbito de las criptomonedas.
Latest Articles
Stay ahead of the market.
Get curated U.S. market news, insights and key dates delivered to your inbox.

AInvest
PRO
AInvest
PRO
Comments
No comments yet