
Market Overview for Basic Attention Token/Tether (BATUSDT)
Summary
• Price moved between 0.2085 and 0.2222, forming key support and resistance clusters.
• Momentum shifted direction multiple times, suggesting indecision in the 0.212–0.216 range.
• Volatility expanded in the late hours, with a 5.2% swing in the final 3-hour window.
• Volume surged during the 15:45–16:45 ET period, confirming a breakout attempt.
• Key Fibonacci levels at 0.2145 and 0.2185 provided partial confluence for price reactions.
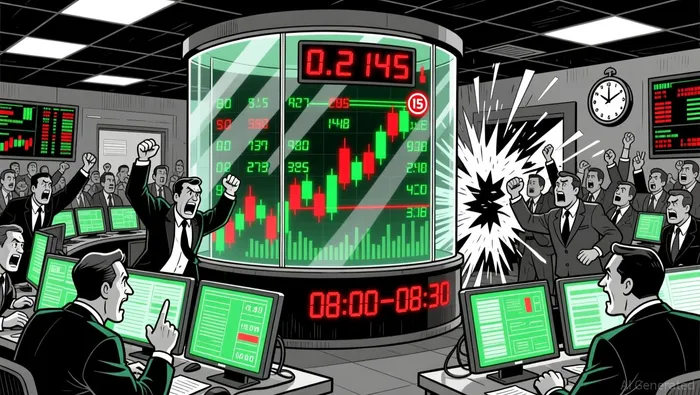
Basic Attention Token/Tether (BATUSDT) opened at 0.2152 on 2025-12-17 12:00 ET, reached a high of 0.2222, a low of 0.2085, and closed at 0.2157 at 2025-12-18 12:00 ET. Total 24-hour volume was 10,112,111.0 and notional turnover amounted to 2,095,172.57.
Structure & Moving Averages
Price action showed a bearish bias in the early part of the session before consolidating in the 0.210–0.216 range.
 On the 5-minute chart, the 20-period MA (0.2136) acted as a dynamic support, while the 50-period MA (0.2145) offered slight resistance. The 50-period MA on the daily chart (0.2160) remains above the current price, indicating a potential near-term reversal scenario if buyers reassert control.
 Momentum and Volatility
MACD showed a bearish crossover in the early hours before flipping to bullish in the last 6 hours, suggesting a possible short-term trend shift. RSI fluctuated between 30 and 70, avoiding overbought/oversold extremes, though it briefly touched overbought territory in the 14:00–15:30 ET window. Volatility, as measured by Bollinger Bands, expanded during the breakout attempt around 15:45 ET, with price closing near the upper band at 0.2213.
Volume and Turnover
The highest volume spike occurred at 15:45 ET with 326,270 contracts traded, coinciding with the upper Bollinger Band and the 0.2222 high. Turnover confirmed this with a sharp increase in notional value. A volume divergence appeared around 08:00–08:30 ET, where price declined but volume remained muted, suggesting weakening bearish conviction.
Fibonacci and Pattern Implications
Key Fibonacci retracement levels at 0.2145 and 0.2185 served as price magnets, with the former acting as a consolidation zone and the latter providing temporary resistance. A bullish engulfing pattern formed around 12:00–12:15 ET, though it was quickly retraced, indicating weak follow-through. A potential bearish flag pattern developed during the 09:00–10:00 ET pullback, which could signal a resumption of the downward trend.
The next 24 hours may see renewed attempts to test the 0.2101 support and 0.2222 resistance. Investors should remain cautious as volatility and volume may diverge again if a breakout fails to hold.
Decoding market patterns and unlocking profitable trading strategies in the crypto space
Latest Articles
Stay ahead of the market.
Get curated U.S. market news, insights and key dates delivered to your inbox.


Comments
No comments yet