
Market Overview for Band/Tether (BANDUSDT): Volatility and Weakness in 24 Hours
Summary
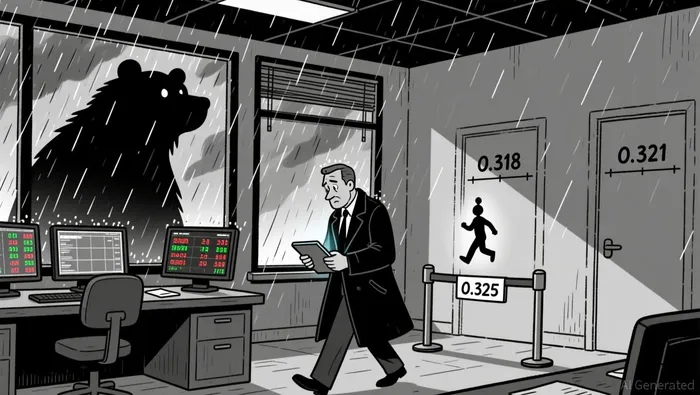
• Price action on BANDUSDTBAND-- shows consolidation below 0.325 amid bearish momentum.
• Volatility surged after 0:00 ET, with a key 0.318 level tested.
• MACD turned bearish while RSI hovered near 50, suggesting mixed sentiment.
Band/Tether (BANDUSDT) opened at 0.326 on 2025-12-25 at 12:00 ET, reached a high of 0.327, and a low of 0.317, closing at 0.323 at 12:00 ET on 2025-12-26. Total volume was 664,233.6, and turnover amounted to 210,620.67 USDT.
Structure & Formations
Price action revealed a bearish breakdown below the 0.325 psychological level. A key swing low formed at 0.318, and a bearish engulfing pattern appeared at 0.322-0.323. A doji at 0.325 suggested indecision, though no strong reversal structure emerged.
Moving Averages and Momentum
The 20- and 50-period 5-min EMAs remained bearish, sloping downward. On the daily chart, the 50-period EMA at ~0.330 is well above the current price. MACD turned negative with bearish divergence, while RSI hovered around 50, suggesting a lack of clear overbought or oversold conditions.
Volatility and Bollinger Bands
Volatility expanded significantly after midnight ET, with price testing the lower Bollinger band at 0.318. The band width had been narrow before 0:00, indicating a period of consolidation followed by a breakout.
Volume and Turnover
Volume spiked sharply in the late-night to early-morning session, especially after 0:00 ET, as selling pressure intensified. Turnover confirmed the volume surge, showing no divergence with price.
Fibonacci Retracements
On the 5-minute chart, the 61.8% retracement of the recent bullish swing from 0.317 to 0.327 is at 0.321, currently a key support zone. Daily retracements suggest that 0.314 (38.2%) could be the next level to watch in a further decline.
BANDUSDT appears to be in a bearish consolidation phase, with 0.318–0.321 forming a near-term support cluster. A break below that could target 0.314–0.315, while a recovery to 0.325–0.327 may signal a short-term bounce. Traders should watch for volume confirmation on any directional move, with the next 24 hours likely testing the resilience of this support range.
Decoding market patterns and unlocking profitable trading strategies in the crypto space
Latest Articles
Stay ahead of the market.
Get curated U.S. market news, insights and key dates delivered to your inbox.


Comments
No comments yet