
Market Overview for Band/Tether (BANDUSDT)


Summary
• Price tested key support at 0.305 before rebounding decisively.
• Rising volume confirms strength in consolidation toward 0.316.
• MACD and RSI suggest momentum could build toward 0.320–0.325.
• Bollinger Band contraction hints at potential breakout volatility.
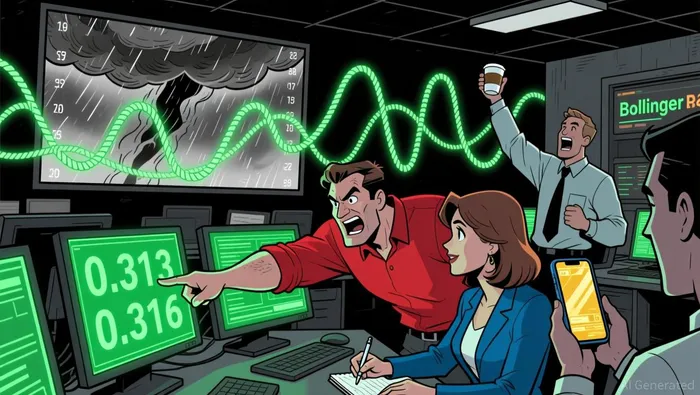
• Fibonacci retracements show 0.313 as a probable short-term pivot.
Band/Tether (BANDUSDT) opened at 0.318 and traded between 0.294 and 0.320 over the past 24 hours, closing at 0.317 at 12:00 ET. Total volume reached 752,729.3, with notional turnover at $235,220.
Structure & Formations
Price action revealed a strong rejection at 0.305, followed by a measured rebound toward 0.316. A bullish engulfing pattern emerged after the 0.314 low, suggesting short-term buyers are active. Key resistance appears to reside near 0.320–0.325, with a 0.313 pivot offering immediate support.
Moving Averages
The 20 and 50-period moving averages on the 5-minute chart intersected near 0.312–0.316, indicating a potential bullish crossover as price consolidates. Longer-term averages on the daily chart (50/100/200) remain broadly aligned, supporting a neutral to moderately bullish outlook.
Momentum and Volatility
Relative Strength Index (RSI) moved from oversold levels around 0.304 toward 50, signaling strengthening momentum. MACD crossed into positive territory with a growing histogram, reinforcing the bullish trend. Bollinger Bands showed a slight contraction before widening again, hinting at increasing volatility.
Volume and Turnover
Volume spiked significantly during the 0.305–0.314 recovery, confirming the rebound. Notional turnover increased in line with price action, with no major divergence noted. Strong buying pressure emerged in the 5–9 AM ET window, supporting a continuation case.
Fibonacci Retracements
Fibonacci levels from the 0.294 to 0.318 move highlight 0.313 as 38.2% and 0.316 as 61.8%. These levels align with key support and pivot points, suggesting price could pause at 0.313 before testing the next resistance at 0.320–0.325.
Price may continue to consolidate above 0.313 in the next 24 hours, but a break below that level could trigger a deeper test of support at 0.305. Investors should remain cautious of potential pullbacks and watch for volume confirmation on any key breakouts.
Decoding market patterns and unlocking profitable trading strategies in the crypto space
Latest Articles
Stay ahead of the market.
Get curated U.S. market news, insights and key dates delivered to your inbox.


Comments
No comments yet