
Market Overview: Axie Infinity/Tether (AXSUSDT) on 2025-12-24
Summary
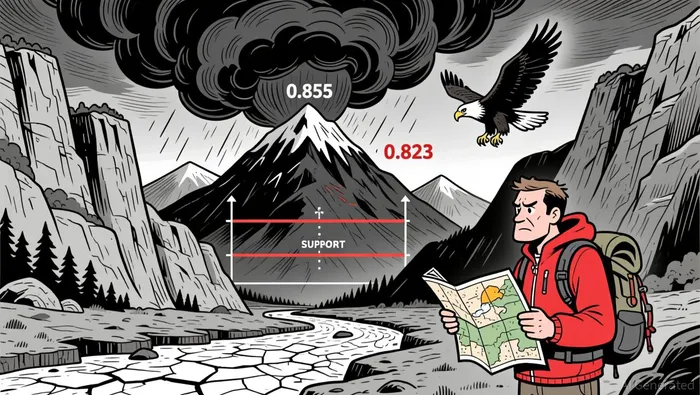
• Price traded in a tight range, with key support at 0.833 and resistance at 0.855.
• Momentum dipped toward the end of the 24-hour period, suggesting fading bullish pressure.
• Volatility remained low, with Bollinger Bands narrowing, indicating potential for a breakout or consolidation.
• Volume surged around the 0.855 level but tailed off near 0.833, hinting at uneven buying conviction.
• RSI entered oversold territory in late hours, suggesting possible short-term reversal potential.
Axie Infinity/Tether (AXSUSDT) opened at 0.833, hit a high of 0.878, and a low of 0.823 before closing at 0.833 as of 12:00 ET. The 24-hour volume totaled 1,216,431.12, with a notional turnover of $979,721.68.
Structure & Formations
Price formed a bearish engulfing pattern near the 0.855 level before retreating, indicating potential seller entry. A doji emerged near 0.823, hinting at indecision at the lower end of the range. Key support at 0.833 held through most of the session, but it showed signs of weakening in the final hours.
Moving Averages
Short-term moving averages (20/50) on the 5-minute chart showed a slight bullish bias in the mid-session hours but flattened out toward the close. Daily 50/100/200 lines remained neutral, with price hovering just below the 50-day average.
MACD & RSI
MACD lines flattened and remained below the zero line, reflecting reduced bullish momentum. RSI dipped below 30 in the final hours, indicating oversold conditions, which may signal a short-term bounce.
Bollinger Bands
Bollinger Bands constricted during the latter half of the day, suggesting a potential breakout or breakout failure. Price remained within the band range throughout, with no clear directional bias.
Volume & Turnover
Volume spiked around 0.855 but declined as the price approached 0.833, suggesting uneven buying pressure. Turnover aligned with price action, confirming the lack of conviction in the final hours.
Fibonacci Retracements
Recent 5-minute swings highlighted key 38.2% and 61.8% levels at 0.850 and 0.840 respectively. The 61.8% retracement level aligned with support at 0.833, which saw repeated testing late in the session.
The market may test the 0.833 support level again in the next 24 hours, with a potential bounce if buyers step in. Investors should watch for divergence between price and momentum indicators to gauge the likelihood of a reversal. As always, volatility remains a risk factor, particularly around key Fibonacci and moving average levels.
Descifrar patrones de mercado y desarrollar estrategias de trading rentables en el ámbito de las criptomonedas.
Latest Articles
Stay ahead of the market.
Get curated U.S. market news, insights and key dates delivered to your inbox.


Comments
No comments yet