
Market Overview for Avalanche/Tether (AVAXUSDT) as of 2025-12-12


Summary
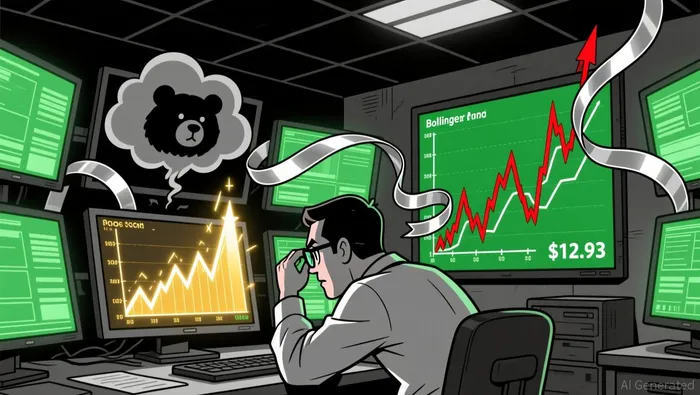
• AVAXUSDT rallied from $12.81 to $13.78 before consolidating and retreating toward $12.93.
• A key bullish 5-minute engulfing pattern formed at $13.02–$13.16, suggesting short-term resistance.
• Volume surged during the rally but declined after the peak, indicating potential exhaustion.
• Bollinger Bands expanded during the upswing and have since contracted, signaling reduced volatility.
• RSI reached overbought levels above 70 twice during the rally, while MACD showed bearish divergence after the $13.78 high.
Avalanche/Tether (AVAXUSDT) opened at $13.04 on 2025-12-11 at 12:00 ET, reached a high of $13.78, touched a low of $12.81, and closed at $12.93 as of 12:00 ET on 2025-12-12. Total 5-minute volume for the 24-hour period was 1,566,728.93 AVAXAVAX--, with notional turnover of approximately $21.75 million.
Structure and Candlestick Patterns
Price formed a bullish engulfing pattern on the 5-minute chart near $13.02–$13.16, followed by a bearish harami at $13.76–$13.75, which may signal a reversal or consolidation phase. A long lower shadow appeared during the pullback to $12.93–$12.84, suggesting support around the $12.85–$12.90 range.
Moving Averages
The 20-period and 50-period moving averages on the 5-minute chart showed a bullish crossover around $13.05–$13.10, confirming the initial rally. On the daily chart, price closed above the 50-day MA but remains below the 200-day MA, indicating mixed-term sentiment.
Momentum Indicators
RSI climbed above 70 twice during the $13.60–$13.78 upswing, signaling overbought conditions. MACD showed a positive divergence during the initial rally but turned bearish after the $13.78 high, with the histogram contracting after the peak.
Volatility and Bollinger Bands
Bollinger Bands expanded significantly during the 5-minute rally from $13.20 to $13.78, then contracted during the pullback to $12.93–$12.81, suggesting reduced volatility and potential consolidation. Price is currently trading near the lower band at $12.81–$12.93, hinting at possible support.
Volume and Turnover
Volume spiked during the $13.20–$13.78 move, with the largest 5-minute volume reaching 115,376.95 AVAX at the peak of the downtrend. Notional turnover declined after the $13.78 high despite continued price movement, suggesting a lack of conviction in the bearish move.
**
Fibonacci Retracements
The 5-minute swing from $12.81 to $13.78 saw key Fibonacci levels at 38.2% ($13.39) and 61.8% ($13.33) acting as dynamic resistance during the pullback. On the daily chart, the 61.8% retracement level near $13.25 has been a significant support area in recent weeks.
Traders may watch for a test of the $12.85–$12.90 support zone and a potential bounce or break. A retest of $13.30–$13.40 could offer a buying opportunity for bullish traders, but caution is warranted if volume remains weak and MACD fails to confirm a reversal.
Decoding market patterns and unlocking profitable trading strategies in the crypto space
Latest Articles
Stay ahead of the market.
Get curated U.S. market news, insights and key dates delivered to your inbox.


Comments
No comments yet