
Market Overview for Arbitrum/Bitcoin (ARBBTC)


Summary
• Price declined from 2.39e-06 to 2.28e-06 amid waning momentum and bearish engulfing patterns.
• Volatility expanded after 18:45 ET, followed by a sharp sell-off below key support.
• MACD diverged below zero, while RSI approached oversold levels after 03:00 ET.
• Bollinger Bands widened during the drop, indicating increased bearish pressure.
• Turnover spiked during the 20:45 ET candle but failed to support a rebound.
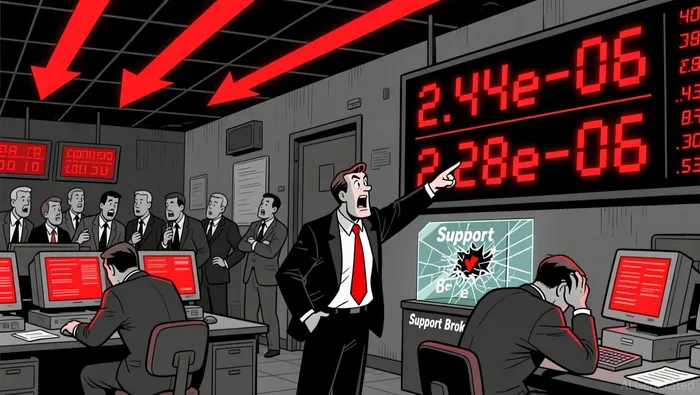
Arbitrum/Bitcoin (ARBBTC) opened at 2.38e-06 on 2025-12-10 12:00 ET, peaked at 2.44e-06, and closed at 2.28e-06 on 2025-12-11 12:00 ET. The 24-hour volume was 1,101,214.5 units, with a notional turnover of 2.66 BTC.
Structure & Moving Averages
Price formed a bearish trendline from 2.44e-06, breaking below key support at 2.38e-06.
 The 5-minute 20SMA crossed below the 50SMA in a death cross formation, reinforcing the downward bias. On the daily chart, the 50DMA acted as a resistance, with price failing to recover above it for most of the period.
 Momentum Indicators
The MACD crossed below zero during the 20:45 ET candle and remained negative, indicating bearish momentum. RSI reached 28 by 05:00 ET, signaling oversold conditions, but failed to trigger a rebound, suggesting exhaustion rather than a reversal.
Volatility and Bollinger Bands
Volatility expanded after 18:45 ET, with a sharp drop in price breaking below the lower Bollinger Band. The widening bands reflected increased uncertainty in the market. The price stayed near the lower band for most of the night, highlighting bearish control.
Volume and Turnover
Volume surged during the 20:45 ET candle, with a turnover of 200,670.2 units, but this failed to support a sustained move higher. A divergence was observed between volume and price during the 01:00 ET session, where high turnover failed to push prices meaningfully higher.
Fibonacci Retracements
Price retested the 38.2% retracement level at 2.40e-06 before falling further. The 61.8% level at 2.32e-06 acted as a temporary floor, but failed to hold during the early morning selloff.
Over the next 24 hours, ARBBTC may test the 2.26e-06 level with a risk of further downside, especially if RSI fails to rebound. Traders should monitor the 2.30e-06 level for potential short-term bounces but remain cautious on longs.
Decoding market patterns and unlocking profitable trading strategies in the crypto space
Latest Articles
Stay ahead of the market.
Get curated U.S. market news, insights and key dates delivered to your inbox.


Comments
No comments yet