
Market Overview: Act I : The AI Prophecy/Tether (ACTUSDT) on 2026-01-19
Summary
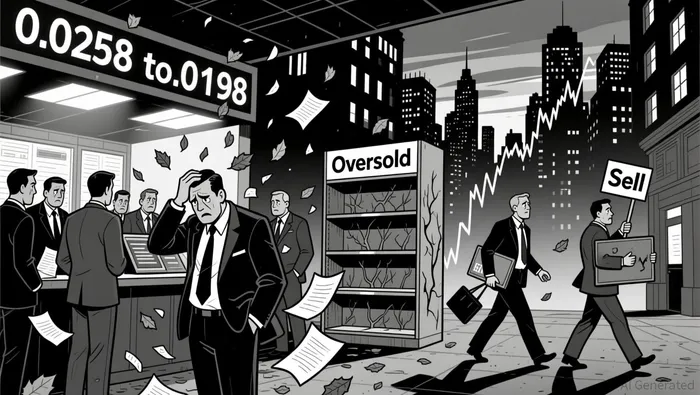
• Price broke below key support at 0.0245, triggering a sharp 24-hour decline to 0.0222.
• Volume surged dramatically at the bottom, indicating possible capitulation or buying pressure.
• RSI and MACD confirm bearish momentum with no signs of reversal yet.
• Bollinger Bands show increasing volatility with price lingering near the lower band.
• Fibonacci levels now focus on 0.0236 as near-term resistance and 0.0219 as next support.
At 12:00 ET-1, Act I : The AI Prophecy/Tether (ACTUSDT) opened at 0.0255 and traded as high as 0.0258 before closing at 0.0222 by 12:00 ET. The pair saw a low of 0.0198 during the session, with total volume reaching 44,592,301.45 and turnover hitting $990,628.06.
Structure and Formations
Price action formed a bearish breakdown from a 24-hour high near 0.0258, followed by a rapid descent to a key support level at 0.0245, which failed to hold. A sharp drop to 0.0198 was capped by a volume spike that suggests a potential short-term bottoming process.
Technical Indicators
The 20-period and 50-period moving averages on the 5-minute chart accelerated downward, confirming the bearish trend. RSI plunged into oversold territory but failed to rebound, suggesting continued pressure. MACD remains negative with a bearish crossover, amplifying the bearish signal.
Volatility and Bollinger Bands
Bollinger Bands expanded significantly, with price trading near the lower band for much of the session. This indicates heightened volatility and a potential continuation of the bearish trend unless buyers re-enter above 0.0232.
Volume and Turnover
Volume spiked sharply during the collapse to 0.0198, with a single 5-minute interval recording over 6 million units traded. However, turnover did not follow suit, suggesting the bulk of volume may be wash trading or order book depth rather than genuine buying pressure.
Fibonacci Retracement Levels
The 61.8% Fibonacci retracement level at 0.0236 now serves as the key near-term resistance. A failure to reclaim this level could extend the downtrend to the next Fibonacci target at 0.0219.
Market participants may look for a test of 0.0232 in the next 24 hours as a potential reversal point, but the risk of further consolidation below 0.023 remains elevated. Investors should remain cautious as volatility is likely to persist.
Decoding market patterns and unlocking profitable trading strategies in the crypto space
Latest Articles
Stay ahead of the market.
Get curated U.S. market news, insights and key dates delivered to your inbox.

AInvest
PRO
AInvest
PRO
Comments
No comments yet