
Market Overview: Acala Token/Tether (ACAUSDT) on 2025-12-28
Summary
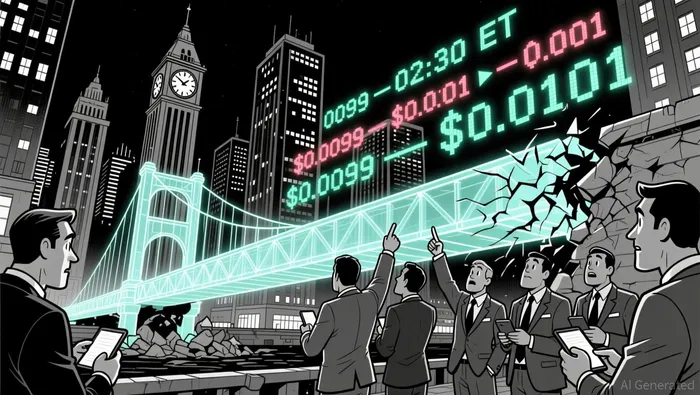
• Price consolidated between $0.0099 and $0.0101 throughout the 24-hour window.
• Volume surged at 02:30 ET, confirming a bullish attempt but failed to break above $0.0101.
• RSI remains in neutral territory, suggesting balanced momentum with no overbought or oversold signals.
• Bollinger Bands show minimal volatility expansion, indicating a ranging market with limited directional bias.
• Volume and turnover closely aligned, with no significant divergence observed during key price moves.
24-Hour Price and Volume Summary
Acala Token/Tether (ACAUSDT) opened at $0.0099, touched a high of $0.0101, and remained in a tight range before closing at $0.0099 by 12:00 ET. The total 24-hour volume amounted to approximately 9,918,180 ACA, with notional turnover of roughly $99,062.
Structure & Formations
Price action remained within a narrow range for much of the 24-hour period, forming a consolidation pattern between the key support at $0.0099 and resistance at $0.0101. A failed bullish breakout attempt occurred at 02:30 ET when price briefly reached $0.0101 but failed to hold the level. Several long-bodied bullish and bearish candles were observed, but no decisive reversal patterns such as engulfing or doji emerged.
Volatility and Moving Averages
Bollinger Bands showed minimal expansion, confirming a low-volatility environment. On the 5-minute chart, the 20-period and 50-period moving averages were closely aligned, suggesting a flat trend. No clear short-term directional bias was evident, and price repeatedly tested both the upper and lower Bollinger channels without breaking out.
Momentum and Indicators
The MACD remained close to the zero line, with no significant histogram divergence, suggesting balanced bullish and bearish momentum. RSI fluctuated between 40 and 60, indicating a neutral zone without overbought or oversold conditions. Volume and turnover were in sync, with no notable divergence during key price levels, particularly around $0.0101.
Fibonacci Retracements
Applying Fibonacci retracements to the recent 5-minute swing between $0.0099 and $0.0101, price frequently tested the 50% retracement level without breaking through. On the daily chart, the pair remains near key psychological levels that may act as short-term barriers to either side.
The market appears to be in a waiting pattern, with price bound between $0.0099 and $0.0101. A breakout could occur with a strong directional catalyst, but for now, the balance remains neutral. Traders may watch for a decisive close beyond either level over the next 24 hours, though risk remains limited in a low-volatility environment.
Decoding market patterns and unlocking profitable trading strategies in the crypto space
Latest Articles
Stay ahead of the market.
Get curated U.S. market news, insights and key dates delivered to your inbox.


Comments
No comments yet