
Market Overview for Aavegotchi/Tether on 2025-12-31
Summary
• Aavegotchi/Tether (GHSTUSDT) traded in a tight 0.168–0.173 range with mixed momentum.
• Volume spiked near 0.17, suggesting possible short-term interest or profit-taking.
• RSI remains in neutral territory, while price remains above 20-period moving average.
• Bollinger Bands show contraction late in the session, hinting at a potential breakout.
• No strong reversal patterns identified, though bullish volume divergence emerged near 0.168.
Aavegotchi/Tether (GHSTUSDT) opened at 0.173 on 2025-12-30 12:00 ET, reached a high of 0.173, a low of 0.167, and closed at 0.169 on 2025-12-31 12:00 ET. Total volume was 381,675.9, and notional turnover was 63,128.23 USD over the 24-hour window.
Structure & Formations
Price remained range-bound within a 0.168–0.173 band throughout the session, with no strong reversal patterns emerging. A notable bearish breakdown to 0.168 occurred at 00:15 ET, followed by consolidation. The 0.169 level acted as a key support, with the price rebounding from it multiple times.
Moving Averages
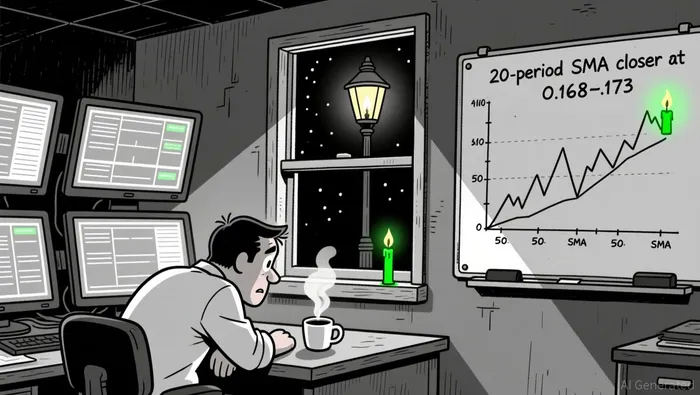
On the 5-minute chart, price remained above the 20-period SMA, indicating short-term bullish bias. The 50-period SMA provided a baseline near 0.171, with price hovering slightly below. Daily moving averages are not calculated here due to lack of full daily data.
MACD & RSI
The MACD showed mixed signals, with the histogram oscillating around the zero line, while the signal line remained flat. RSI ended near 50, suggesting neutral momentum. No overbought or oversold conditions were observed, with price showing no clear directional bias in the final hours.
Bollinger Bands
Bollinger Bands contracted significantly in the final hours of the session, especially between 05:00 and 08:00 ET, suggesting a potential breakout or breakdown in the near term. Price remained within the band for most of the period, with the upper and lower bands fluctuating between 0.173 and 0.167.
Volume & Turnover
Volume spiked to 50k+ near the 0.168–0.171 range, indicating accumulation or distribution activity. Notional turnover followed a similar pattern, with the highest spikes occurring between 00:30 and 02:30 ET. Price and turnover aligned during key moves near 0.168 and 0.17, suggesting genuine participation.
Fibonacci Retracements
Fibonacci levels drawn on the recent 0.167–0.173 swing showed the 0.169 level coinciding with the 38.2% retracement, where price found support multiple times. The 61.8% retracement at 0.168 also acted as a key level, with price bouncing off it after the early morning breakdown.
While the range-bound action and neutral indicators suggest a period of indecision, the increasing volume and tightening Bollinger Bands hint at a potential breakout. Investors should monitor the 0.168–0.171 range closely over the next 24 hours, as a break above 0.171 could signal a shift in short-term sentiment, with risk of a pullback to 0.167 if bears reassert control.
Decoding market patterns and unlocking profitable trading strategies in the crypto space
Latest Articles
Stay ahead of the market.
Get curated U.S. market news, insights and key dates delivered to your inbox.


AInvest
PRO
AInvest
PRO
Comments
No comments yet