
Market Overview for Aave/Tether (AAVEUSDT)
Summary
• Price tested key support near $164.60, bouncing on high-volume buying.
• RSI showed bearish divergence after reaching overbought levels twice.
• Volatility surged in late ET hours with a 2.5% range swing in under an hour.
• Bollinger Bands expanded, indicating increasing uncertainty and potential breakouts.
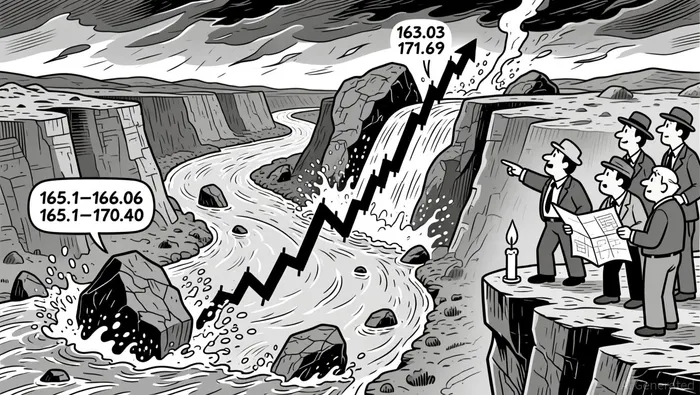
• A large bullish engulfing pattern formed at 165.1–166.06, suggesting short-term reversal.
Aave/Tether (AAVEUSDT) opened at $169.61 on 2026-01-11 12:00 ET, reached a high of $171.69, dipped to a low of $163.03, and closed at $165.73 on 2026-01-12 12:00 ET. Total volume traded was 23,317.37 AAVEAAVE--, with a notional turnover of $3.77 million.
Structure & Formations
AAVEUSDT displayed a distinct short-term bearish bias during the morning ET hours, with price breaking below the 165.1–166.06 bullish engulfing pattern and falling to a low of $163.03. This move was followed by a partial recovery, with price retesting the 166.65–167.15 support cluster. Notable resistance emerged at $169.00 and $170.40, with rejection candles forming at both levels.
Moving Averages
On the 5-minute chart, AAVEUSDTAAVE-- closed below key short-term moving averages (20 and 50-period), indicating a bearish bias. The 200-period daily moving average is currently around $168.50, and price remains below it, suggesting that the broader trend remains bearish.
MACD & RSI
The MACD remained in negative territory throughout the 24-hour period, with bearish crossovers occurring during the afternoon ET sell-off. RSI reached overbought levels at $171.69 and $170.40 but failed to hold above 60, eventually forming bearish divergence as price fell while RSI dropped below 50.
Bollinger Bands
Bollinger Bands saw a marked expansion during the late ET sell-off, with price dropping from near the upper band to the lower band in less than 4 hours. This suggests a period of heightened volatility and uncertainty, and could lead to a consolidation phase or a breakout in either direction.
Volume & Turnover
Volume spiked during the 14:30–15:00 ET window, coinciding with a sharp drop from $163.61 to $161.60. Notional turnover during this period was nearly $1.64 million, or roughly 43% of the 24-hour total. A notable divergence occurred when price continued to fall while volume decreased after 16:00 ET, suggesting weakening bearish momentum.
Fibonacci Retracements
Applying Fibonacci retracements to the $163.03 to $166.06 move, key levels include 38.2% at $164.65 and 61.8% at $165.35. Price currently hovers near the 61.8% level and may face resistance here or find support slightly below it.
Looking ahead, AAVEUSDT could test the 164.65–165.35 range over the next 24 hours, with a potential breakout depending on order flow. Traders should remain cautious, as volume has already signaled potential exhaustion in the current move.
Decoding market patterns and unlocking profitable trading strategies in the crypto space
Latest Articles
Stay ahead of the market.
Get curated U.S. market news, insights and key dates delivered to your inbox.


Comments
No comments yet