
Market Overview for Aave/Tether (AAVEUSDT)


Summary
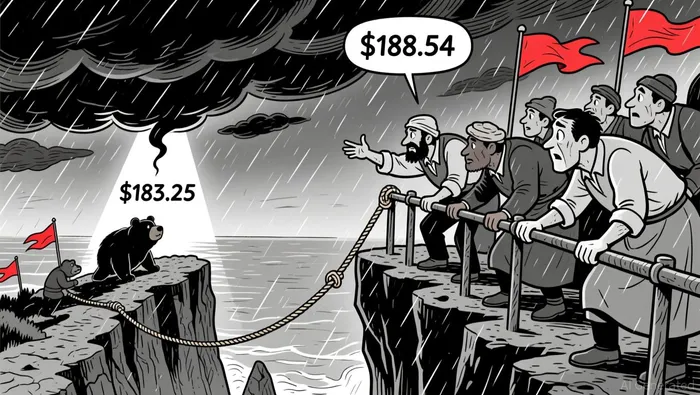
• Price dipped below key support at $188.54, triggering a bearish breakdown.
• Volume surged after 15:00 ET as price hit a 24-hour low of $183.00.
• RSI hit oversold levels, suggesting potential for a short-term bounce.
• Bollinger Band contraction began late in the session, hinting at rising volatility.
• Fibonacci 61.8% level at $189.4 appears to offer immediate resistance on a rebound.
Aave/Tether (AAVEUSDT) opened at $192.45 on 2025-12-14 at 12:00 ET and closed at $183.25 on 2025-12-15 at 12:00 ET. The pair hit a high of $196.73 and a low of $183.00 during the 24-hour period. Total volume was 79,702.48, with notional turnover of approximately $15,339,724.
Structure and Key Levels
The price broke below the critical psychological level of $188.54, a prior support that turned into resistance during earlier attempts to rally. A long lower wick on the candle that closed at $183.25 around 15:30 ET suggests rejection at this level. A bearish engulfing pattern formed at the start of the breakdown, while a morning session rally failed to hold above $195.65, indicating bearish sentiment.
Trend and Momentum
The 20- and 50-period moving averages on the 5-minute chart remained bearish, confirming the downward trend. RSI hit oversold territory near 28 by the end of the session, signaling potential for a bounce near $184.32, though momentum remains weak.
 The MACD line crossed below the signal line, confirming bearish momentum with a negative histogram.
 Volatility and Bollinger Bands
Bollinger Bands contracted in the final hours of the session, suggesting a potential breakout or breakdown was imminent. Price settled near the lower band at $183.25, indicating a high-volatility move had concluded, with the next move likely to test the 61.8% Fibonacci retracement level at $189.40.
Volume and Turnover
Volume spiked significantly as the price fell below $188.54 and continued to decline, reaching a 24-hour low. Turnover increased by over 300% between 15:00 and 16:00 ET as selling pressure intensified. The divergence between volume and price during the attempted rally suggests weak conviction.
Looking ahead, a test of the $184.32 support level is likely, with a potential bounce toward the $189.40 Fibonacci level. However, a breakdown below $184.32 could accelerate the decline further. Investors should watch for confirmation of a reversal or a continuation of the bearish trend. As always, manage risk carefully in a volatile market.
Decoding market patterns and unlocking profitable trading strategies in the crypto space
Latest Articles
Stay ahead of the market.
Get curated U.S. market news, insights and key dates delivered to your inbox.


Comments
No comments yet