
Market Overview for Aave/Tether (AAVEUSDT) – 24-Hour Technical Summary


Summary
• Price action on Aave/Tether shows consolidation around key support levels with bearish engulfing patterns.
• Momentum suggests weakening bullish strength, with RSI nearing overbought territory.
• Volatility remains elevated but appears to be stabilizing near 185.00.
• Volume spikes highlight divergent price behavior during midday declines.
• Fibonacci retracement levels at 185.5 and 187.5 suggest potential turning points.
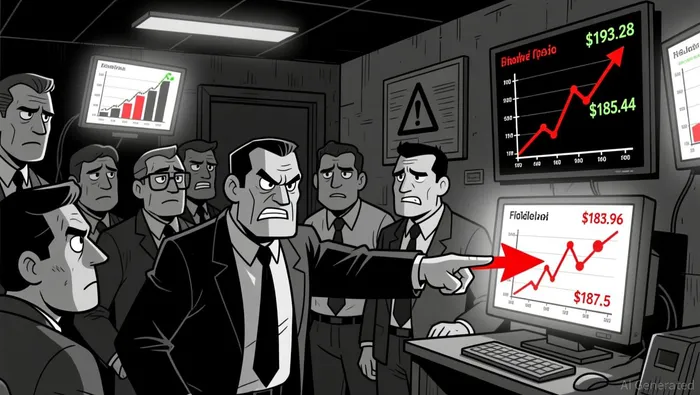
At 12:00 ET on 2025-12-17, Aave/Tether (AAVEUSDT) opened at $187.23, reached a high of $193.28, fell to a low of $178.62, and closed at $179.12. Total volume for the 24-hour window was 37,000.34 AAVEAAVE--, with a notional turnover of approximately $6.94 million.
Structure & Candlestick Patterns
Price action displayed a bearish engulfing pattern at the peak near $193.28, signaling a potential reversal. A long lower shadow at 185.44 to 186.88 suggested short-term support, though a breakdown below 185.00 increased bearish momentum. A doji formed near 183.96, indicating indecision after a sharp decline.
Technical Indicators
The 20-period and 50-period moving averages on the 5-minute chart remained bearish throughout the session, with price failing to close above either. RSI pushed into overbought territory briefly but reversed sharply, suggesting possible exhaustion of bullish momentum. MACD diverged with price during the late afternoon sell-off, reinforcing bearish sentiment.
Bollinger Bands and Volatility
Volatility expanded significantly as the price broke through the upper band during the early afternoon surge to $193.28. A subsequent contraction occurred as price settled near the lower band by the end of the session, pointing to a potential reversal or breakout setup.
Volume and Turnover Divergence
Despite a sharp price decline from $193.28 to $178.62, volume was unusually high, indicating strong selling pressure. However, turnover decreased during the final hour, suggesting exhaustion. This divergence may hint at a temporary bottoming process, though confirmation is pending.
Fibonacci Retracements
Key Fibonacci levels from the $193.28 high to $178.62 low highlight potential turning points at 185.5 (38.2%), 183.4 (50%), and 181.7 (61.8%). The price is currently consolidating near the 61.8% level, which may act as a short-term support or catalyst for a rebound.
Aave/Tether may see a test of the 183.50–184.50 range in the next 24 hours, depending on whether buyers step in at the 61.8% Fibonacci level. Investors should remain cautious about further downside risk if this support fails to hold.
Descifrar los patrones de mercado y desarrollar estrategias de negociación rentables en el ámbito de las criptomonedas.
Latest Articles
Stay ahead of the market.
Get curated U.S. market news, insights and key dates delivered to your inbox.


Comments
No comments yet