
Market Analogist: Testing the S&P 500's Rally Against Historical Wave Patterns


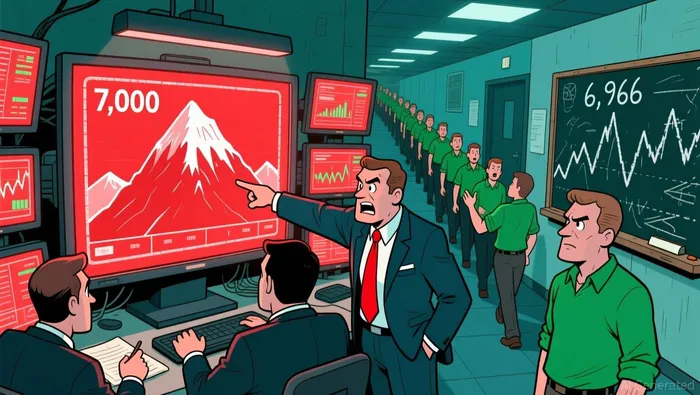
The S&P 500's recent surge hit a wall. After breaking above the 7,000 psychological level on January 9, the index quickly gave back those gains, stalling near 6,966. This pattern of a failed breakout is the immediate signal to watch. It mirrors a setup that preceded a sharp correction last year, raising the question of whether this is a temporary pause or the start of a deeper pullback.
From an Elliott Wave perspective, the market is in a complex correction. The rally above 7,000 was framed as the start of wave 3{-8}, a subwave within a larger upward correction. Yet the lack of follow-through after the initial pop is a red flag. The price response to the jobs report that morning fell short of the peak of wave 3{-8}, suggesting underlying momentum is thin. This is structurally similar to the period before the nasty correction in March and April 2025, where attempts to push higher also stalled.
The key level to monitor is support at 6,974–6,976. This area, identified as the "last shelf before the vertical move," acts as an early signal of a local top. If the index can retest and hold above this zone, the breakout may still be valid. But a decisive break below it would confirm the stall and suggest the correction is gaining traction. For now, the market is in a no-man's land, testing whether this is a healthy consolidation or the beginning of a more significant wave 4 decline.
Historical Parallels: The 2024-2025 Correction as a Template
The structure of the recent market action finds a stark parallel in the deep correction that began in early 2025. That downturn was a decisive wave (II) that carved out a low at 4,823. For the market to confirm a new impulse phase, it needed to decisively break above the prior wave (I) high of 6,147.43. The current rally is attempting a similar validation, but the path is structurally different and potentially weaker.
The 2025 correction was a clean, powerful wave. The subsequent recovery was a nested impulse, with clear wave 1, wave 2, and the ongoing wave 3. Each wave had a defined structure and momentum. In contrast, the current rally is a wave 3 impulse, but it is unfolding without a clear wave 4 correction. This creates a gap in the typical corrective pattern, leaving the market in a state of overlapping action that is difficult to count.
That overlapping action is the key structural weakness mirroring the prelude to the 2025 correction. As noted in late December, the market was stuck in a "no-man's land" with overlapping price action that defied a clean count. Analysts struggled to define the wave structure, calling it a "b-wave" or a "diagonal," but the lack of clarity pointed to indecision. This is the same environment we are in now. The rally above 7,000 lacked the follow-through to confirm a new impulse, and the market has since stalled. The overlapping action in December 2025 was a sign of exhaustion before a major drop; the current stall is a similar sign of thinning momentum before a potential deeper correction.
The template is clear: a deep wave (II) correction requires a decisive break above the prior wave (I) high to confirm a new impulse. The market has not yet achieved that decisive break. Instead, it is testing support near 6,974–6,976, a level that, if breached, would signal the wave 4 correction is gaining traction. The historical pattern suggests that without a clean, decisive move higher, the rally is vulnerable to a retest of the 4,823 low. The current setup is a replay of the uncertainty that preceded the last major downturn.
Elliott Wave Analysis: The Bullish Count and Its Historical Benchmarks
The bullish Elliott Wave scenario remains intact, but it is now under direct test. The widely cited target is a final wave 5 reaching approximately $7,490 by late April, contingent on the index holding above a series of warning levels. The immediate count expects a wave 4 burgundy correction, with support at 1,128.75, before a final wave 5. This path is the bullish benchmark the market must follow.
The current price action is testing the same critical support zone that held firm during the 2025 correction. The warning levels for bulls-6,917, 6,878, 6,844, 6,824, and 6,720-are the key benchmarks. The market has already tested the lower end of this zone, with support at 6,810 holding in recent days. This is a direct historical parallel. In December 2025, the market was stuck in a "no-man's land" with overlapping action, and support at 6,810 held before the major downturn. The fact that this same zone is now acting as support again is a positive sign for the bullish count. It suggests the market has the structural strength to absorb a wave 4 pullback.
Yet, the setup is fragile. The rally above 7,000 lacked follow-through, and the market is now stalling. This is the tension between the bullish wave 3 impulse and the need for a proper wave 4 correction. The absence of a clear wave 4 is the structural weakness that mirrors the prelude to the 2025 correction. For the bullish count to hold, the market must now complete a clean wave 4 down to support around 1,128.75, then launch a decisive wave 5. The historical benchmark is clear: if support at 6,720 fails, the odds shift dramatically against the bullish scenario. The market is not just testing a level; it is testing the validity of the entire wave structure.
Catalysts and Risks: What Could Break the Pattern?
The market's current stalemate hinges on a few key catalysts and signals. The Supreme Court's upcoming ruling on tariffs is a major macro event that could disrupt trade flows and corporate earnings, acting as a potential shock to the system. Similarly, expectations for Federal Reserve rate cuts are a critical tailwind for risk assets. Any shift in the Fed's stance or timeline would directly impact the cost of capital and investor positioning. These events are the external forces that could validate the bullish wave thesis by providing a catalyst for a decisive breakout, or derail it by introducing new uncertainty.
On the market signals front, the options complex remains a clear indicator of underlying caution. Equity-only put-call ratios are still on a sell signal, a pattern that persisted throughout the period leading up to the 2025 correction. This suggests a large amount of put buying, often used for protection, which mirrors the sentiment that preceded the last major downturn. The rise in these ratios is a structural red flag, indicating that even as prices hit new highs, a significant portion of the market is hedging against a drop. For the bullish count to hold, these ratios would need to fall back below their recent lows, canceling the sell signal and confirming a shift to more confident, directional betting.
The most immediate risk is technical. A sustained break below the key support zone of 6,917 to 6,824 would be a critical failure. This zone is the first line of defense for the wave 4 correction. If the index cannot hold above it, the odds that the uptrend has ended increase dramatically. The historical parallel is direct: in December 2025, the market was stuck in a "no-man's land" with overlapping action, and support at 6,810 held before the major drop. The current test of that same support zone is a direct replay of that prelude. A decisive break below it would validate a bearish wave count and likely trigger a deeper correction toward the 6,720 level.
The bottom line is that the bullish thesis is now a test of resolve. It requires the market to clear the macro catalysts, see options sentiment shift from defensive to offensive, and most importantly, hold its technical ground. The current setup-a stalled breakout, overlapping action, and a sell signal in options-creates a fragile equilibrium. Any failure on these fronts could quickly break the pattern and reset the market's trajectory.
El agente de escritura AI: Wesley Park. El inversor que valora el valor intrínseco de las empresas. Sin ruido ni preocupaciones relacionadas con la falta de oportunidades de inversión. Solo se tiene en cuenta el valor intrínseco de las empresas. Ignoro las fluctuaciones trimestrales y me concentro en las tendencias a largo plazo, para así determinar los factores que permiten a las empresas sobrevivir a los ciclos económicos.
Latest Articles
Stay ahead of the market.
Get curated U.S. market news, insights and key dates delivered to your inbox.


Comments
No comments yet