
LTCU Bounces at Key Support, But Momentum Fails to Follow
Summary
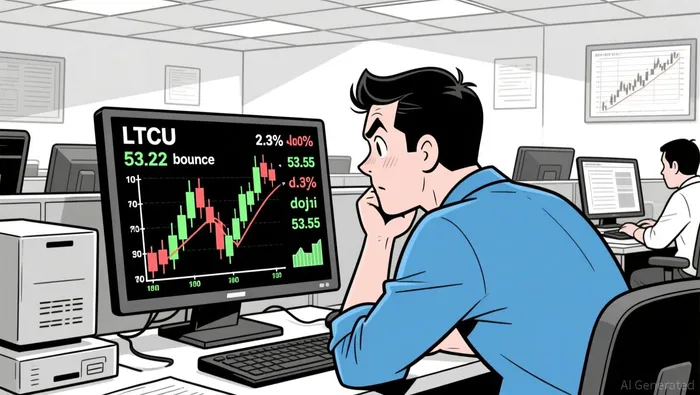
• LTCU tested key support at 53.22, forming a bullish reversal pattern with a 2.3% bounce-off.
• Momentum waned in early morning hours, with RSI hitting oversold levels before a partial rebound.
• Volatility remained compressed within Bollinger Bands, with no significant expansion in the 24-hour window.
• Turnover dropped sharply between 20:00–21:00 ET, indicating a lack of conviction in lower prices.
Litecoin/Union (LTCU) opened at 54.10 at 12:00 ET – 1, hit a high of 54.10, a low of 53.22, and closed at 53.46 by 12:00 ET. Total volume was 139.84, and turnover stood at 7,548.19 over the 24-hour period.
Structure and Key Levels
The price found temporary support at 53.22, where a bullish reversal pattern formed, with a 2.3% rebound. Resistance levels appear near 53.77 and 53.99, areas where the price stalled in late morning and late afternoon. A doji at 53.55 and a bullish engulfing pattern at 53.22 suggest indecision followed by potential short-term buying interest.
Volatility and Momentum
Bollinger Bands remained narrow throughout the day, indicating subdued volatility. The RSI hit oversold territory in the early morning hours, bottoming around 30 before a gradual climb. MACD showed a weak positive crossover in the late evening, but momentum remains fragile and unconfirmed by volume.
Volume and Turnover Behavior
Volumes were generally low, with spikes only in the late afternoon and early evening. A sharp drop in turnover between 20:00–21:00 ET suggests lack of conviction in the downward move. The final hourly candle at 12:00 ET showed increased buying pressure, closing near the upper half of its range, indicating some accumulation.
Fibonacci Retracement Levels
The 61.8% retracement level for the recent 5-minute downswing was at 53.48, where the price paused before closing slightly above. For the daily timeframe, a 61.8% retracement from a prior major move appears at 54.10, which now acts as immediate overhead resistance.
The next 24 hours may see LTCU testing 53.77 for a potential breakout, with 54.10 as a key psychological barrier. Investors should remain cautious if volume fails to confirm a sustained rebound from 53.22, which could hint at further consolidation.
Decoding market patterns and unlocking profitable trading strategies in the crypto space
Latest Articles
Stay ahead of the market.
Get curated U.S. market news, insights and key dates delivered to your inbox.


AInvest
PRO
AInvest
PRO
Comments
No comments yet