
Looking for a diamond in the rough? We review 5 stocks in bearish trends for potential turn arounds
Measuring bearish stocks can be done through various methods and indicators that help identify negative sentiment and potential declines in stock prices. There are numerous ways to measure if a stock is bearish or in a downward trend.
When the short-term moving average crosses below the long-term moving average (e.g., 50-day moving average crossing below the 200-day moving average), it is often seen as a bearish signal. A Relative Strength Index (RSI) below 30 can indicate that a stock is oversold, which often coincides with a bearish trend. Another technical indicator is the Moving Average Convergence Divergence (MACD). When the MACD line crosses below the signal line, it can indicate a bearish trend.
A stock that is declining in price with increasing volume may indicate strong bearish sentiment. Large volumes on days when the stock price drops significantly can signal strong selling pressure. We would note that this can be a counter signal as it could point to the potential that all the sellers have left the asset.
A few patterns for traders to watch include a Head and Shoulders Pattern which often indicates a reversal from a bullish to a bearish trend. There is the infamous Double Top pattern which suggests that the stock has reached a peak and may experience a bearish reversal. Finally there is the Bearish Engulfing Pattern which is a candlestick pattern where a large red candle fully engulfs the previous green candle, indicating potential bearish sentiment.
A high short interest ratio (number of shares sold short divided by the average daily trading volume) can indicate bearish sentiment, as many investors are betting against the stock. A high put/call ratio (more puts than calls) indicates that more investors are betting on a decline in the stock price, which is a bearish signal.
Finally, on the fundamental side consistent declines in a company's earnings and revenue can signal bearish sentiment as it reflects the company's weakening financial health.
Using a combination of these methods can provide a comprehensive view of bearish sentiment in stocks can help investors make informed decisions.
Today, we will simplify the process and take a look at a few stocks with the lowest RSI and do a quick review on whether we see them as buying opportunities.
Papa John's ($PZZA(PZZA)PZZA--)- RSI 13
Papa John's International, Inc. operates and franchises pizza delivery and carryout restaurants. It is divided into several segments: Domestic Company-owned Restaurants, North America Franchising, North America Commissaries, International Operations, and All Others Founded by John H. Schnatter in 1984, the company is headquartered in Louisville, KY.
Papa John's International (PZZA) recently reported weak Q1 results on May 9, driven primarily by a decline in same-store sales in the North American market. The company's shares have dropped from the low-$70s to the low-$50s per share since March, and it currently trades at 21.7 times forward earnings. Despite the poor results, some analysts remain optimistic about a potential recovery, citing the company's overseas expansion and the Back to Better 2.0 strategy.
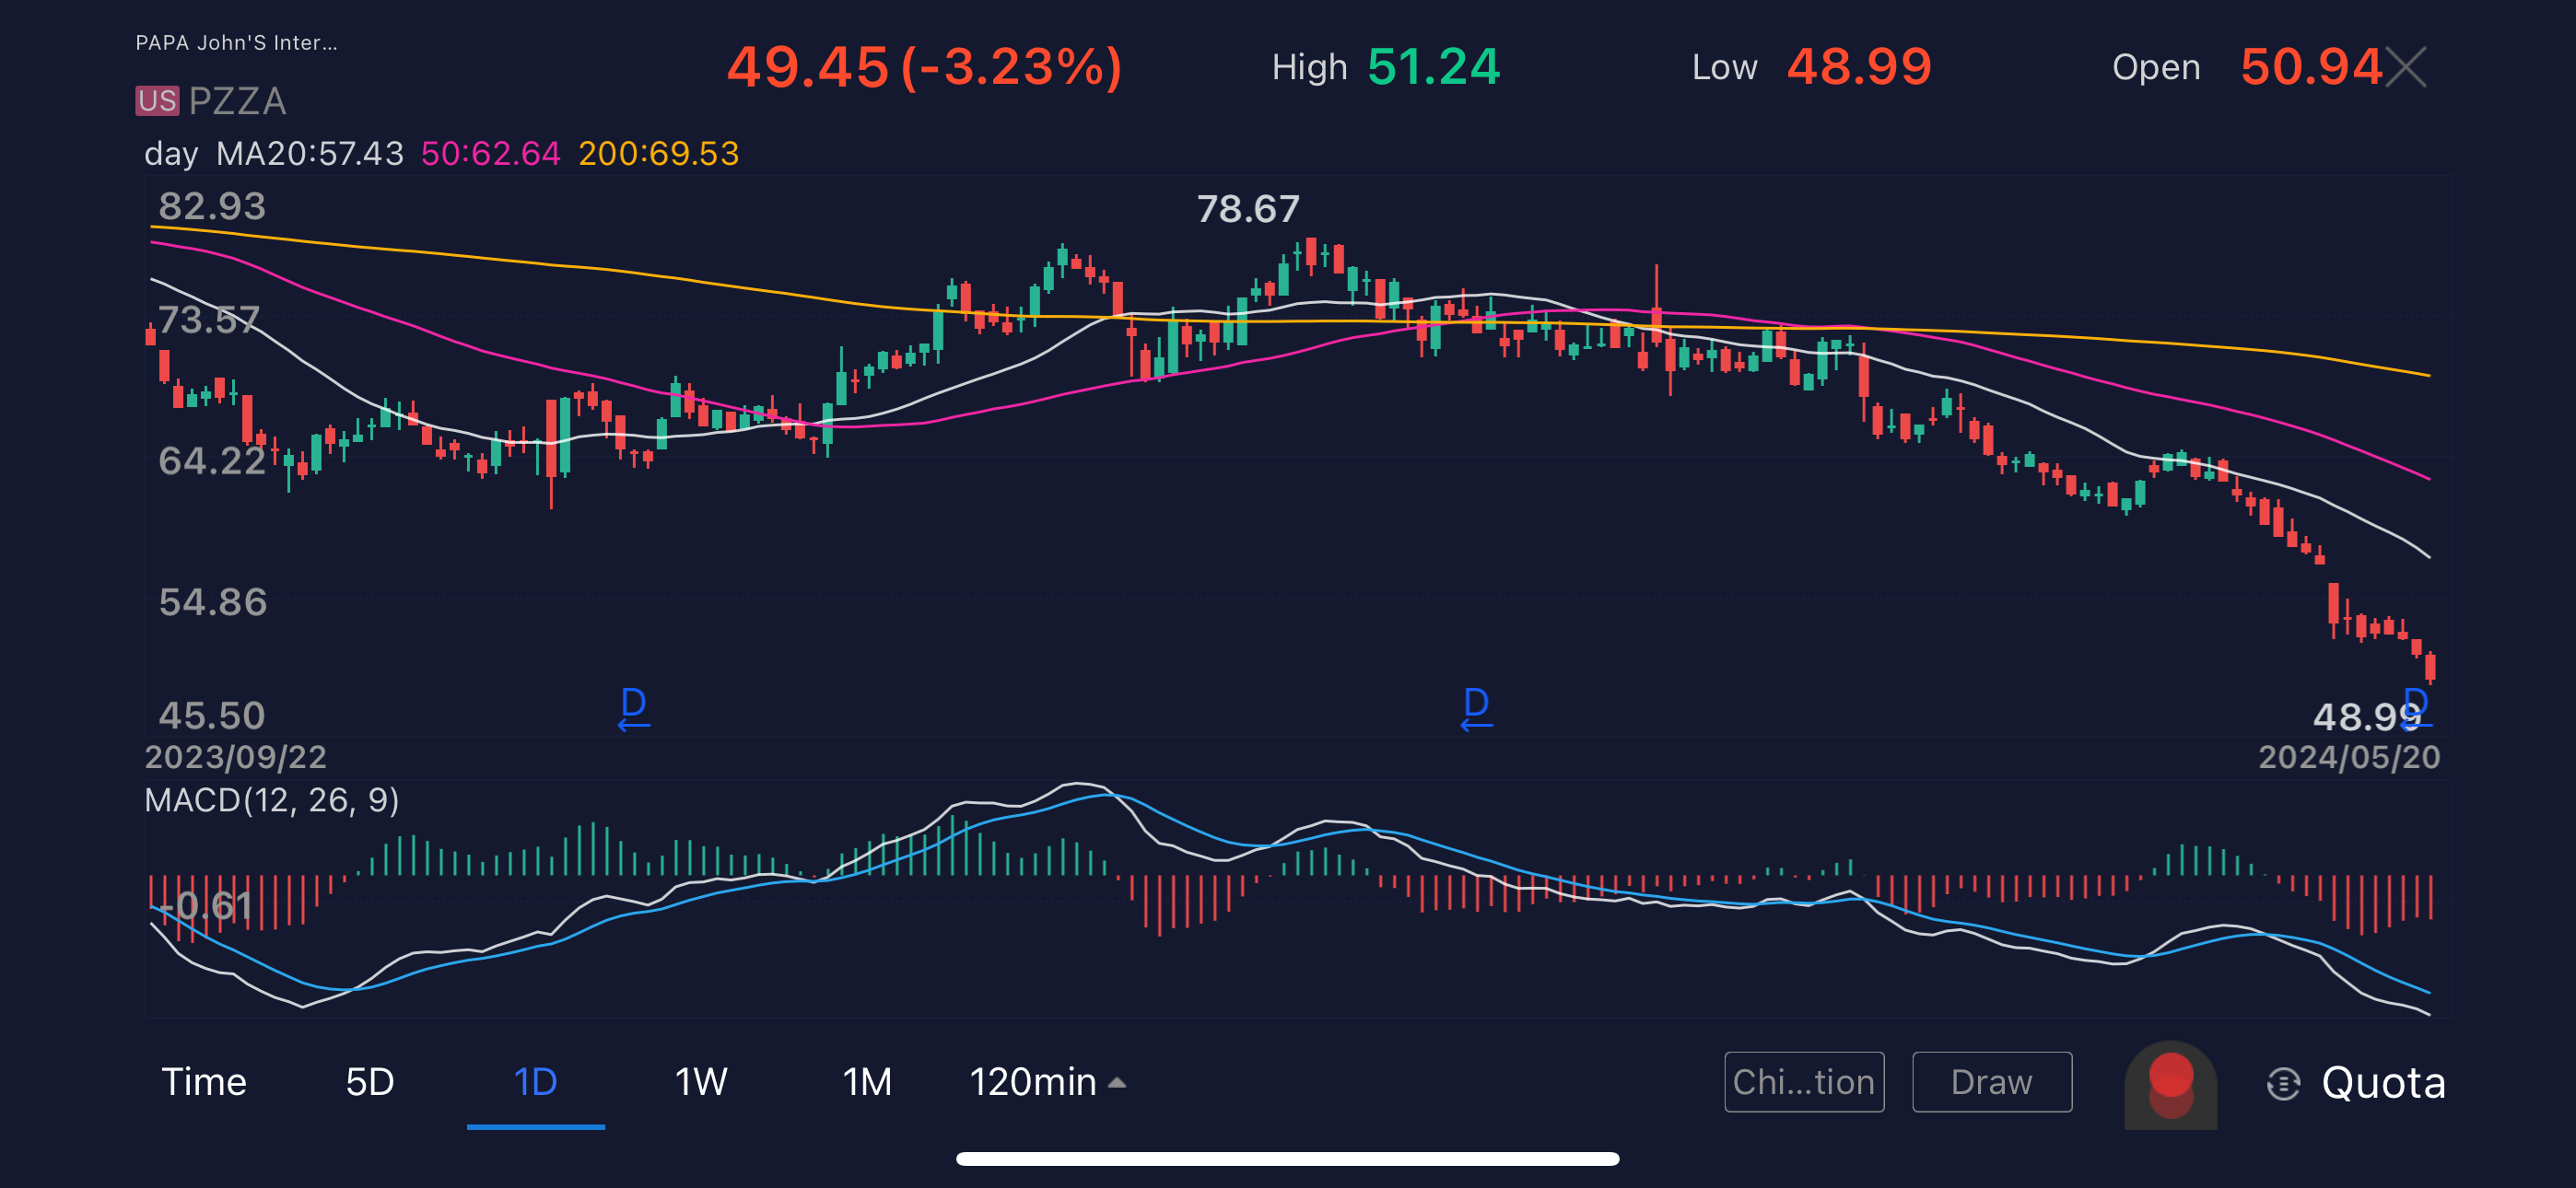
KeyBanc lowered its price target for PZZA from $78 to $64, citing greater-than-expected declines in domestic same-store sales and reduced guidance for North American same-store sales and adjusted EBIT. However, they maintain an Overweight rating, believing sales trends can improve. Benchmark has also reduced its price target from $87 to $75 but maintains a Buy rating. They noted that Q1 earnings were affected by value-seeking consumers, but margins benefited from lower commodity costs and adjustments related to the departure of the former CEO. The company reported Q1 revenues of $176 million, below the consensus of $183 million, but an adjusted EPS of $0.67, beating the consensus of $0.57.
PZZA has been on a downward trend since peaking at $140 in November 2021. The stock is coming in to test the 200-monthly moving average ($51) which sets it up as a potential bounce candidate. But, outside of a quick trade, we would prefer to see some signs of sellers exhaustion before we were willing to step in and buy the stock for a long-term hold.
DLocal Unlimited ($DLO(DLO)DLO--)- RSI 16
DLocal Ltd. (DLO) specializes in simplifying and redefining the online payments experience. The company focuses on processing payment transactions, enabling merchants to receive payments from and make payments to customers in emerging markets. Founded in 2016 by Andres Bzurovski Bay and Sergio Enrique Fogel Kaplan, DLocal is headquartered in Montevideo, Uruguay.
DLocal reported Q1 results with strong total payment volume (TPV) growth of nearly 50% year-over-year and a 34% increase in revenue. However, a 31% decline in revenue from Argentina, mainly due to devaluation, negatively impacted overall results. Despite these challenges, the company's Latin American gross profit would have grown 24% excluding Argentina, with notable increases in Brazil and Mexico. DLocal missed the rule of 100, achieving closer to 60% in EBITDA/gross profit plus gross profit growth.
The stock saw a decline post-earnings, but the company remains a vital partner for global giants like Shopify, Spotify, Amazon, and Nike, facilitating their expansion into emerging markets. While net income and adjusted EBITDA fell short of estimates, operating profit exceeded expectations, indicating resilience in their core operations. With its innovative payment processing solutions for complex markets, DLocal continues to grow rapidly and remains profitable, making it an attractive prospect for investors.
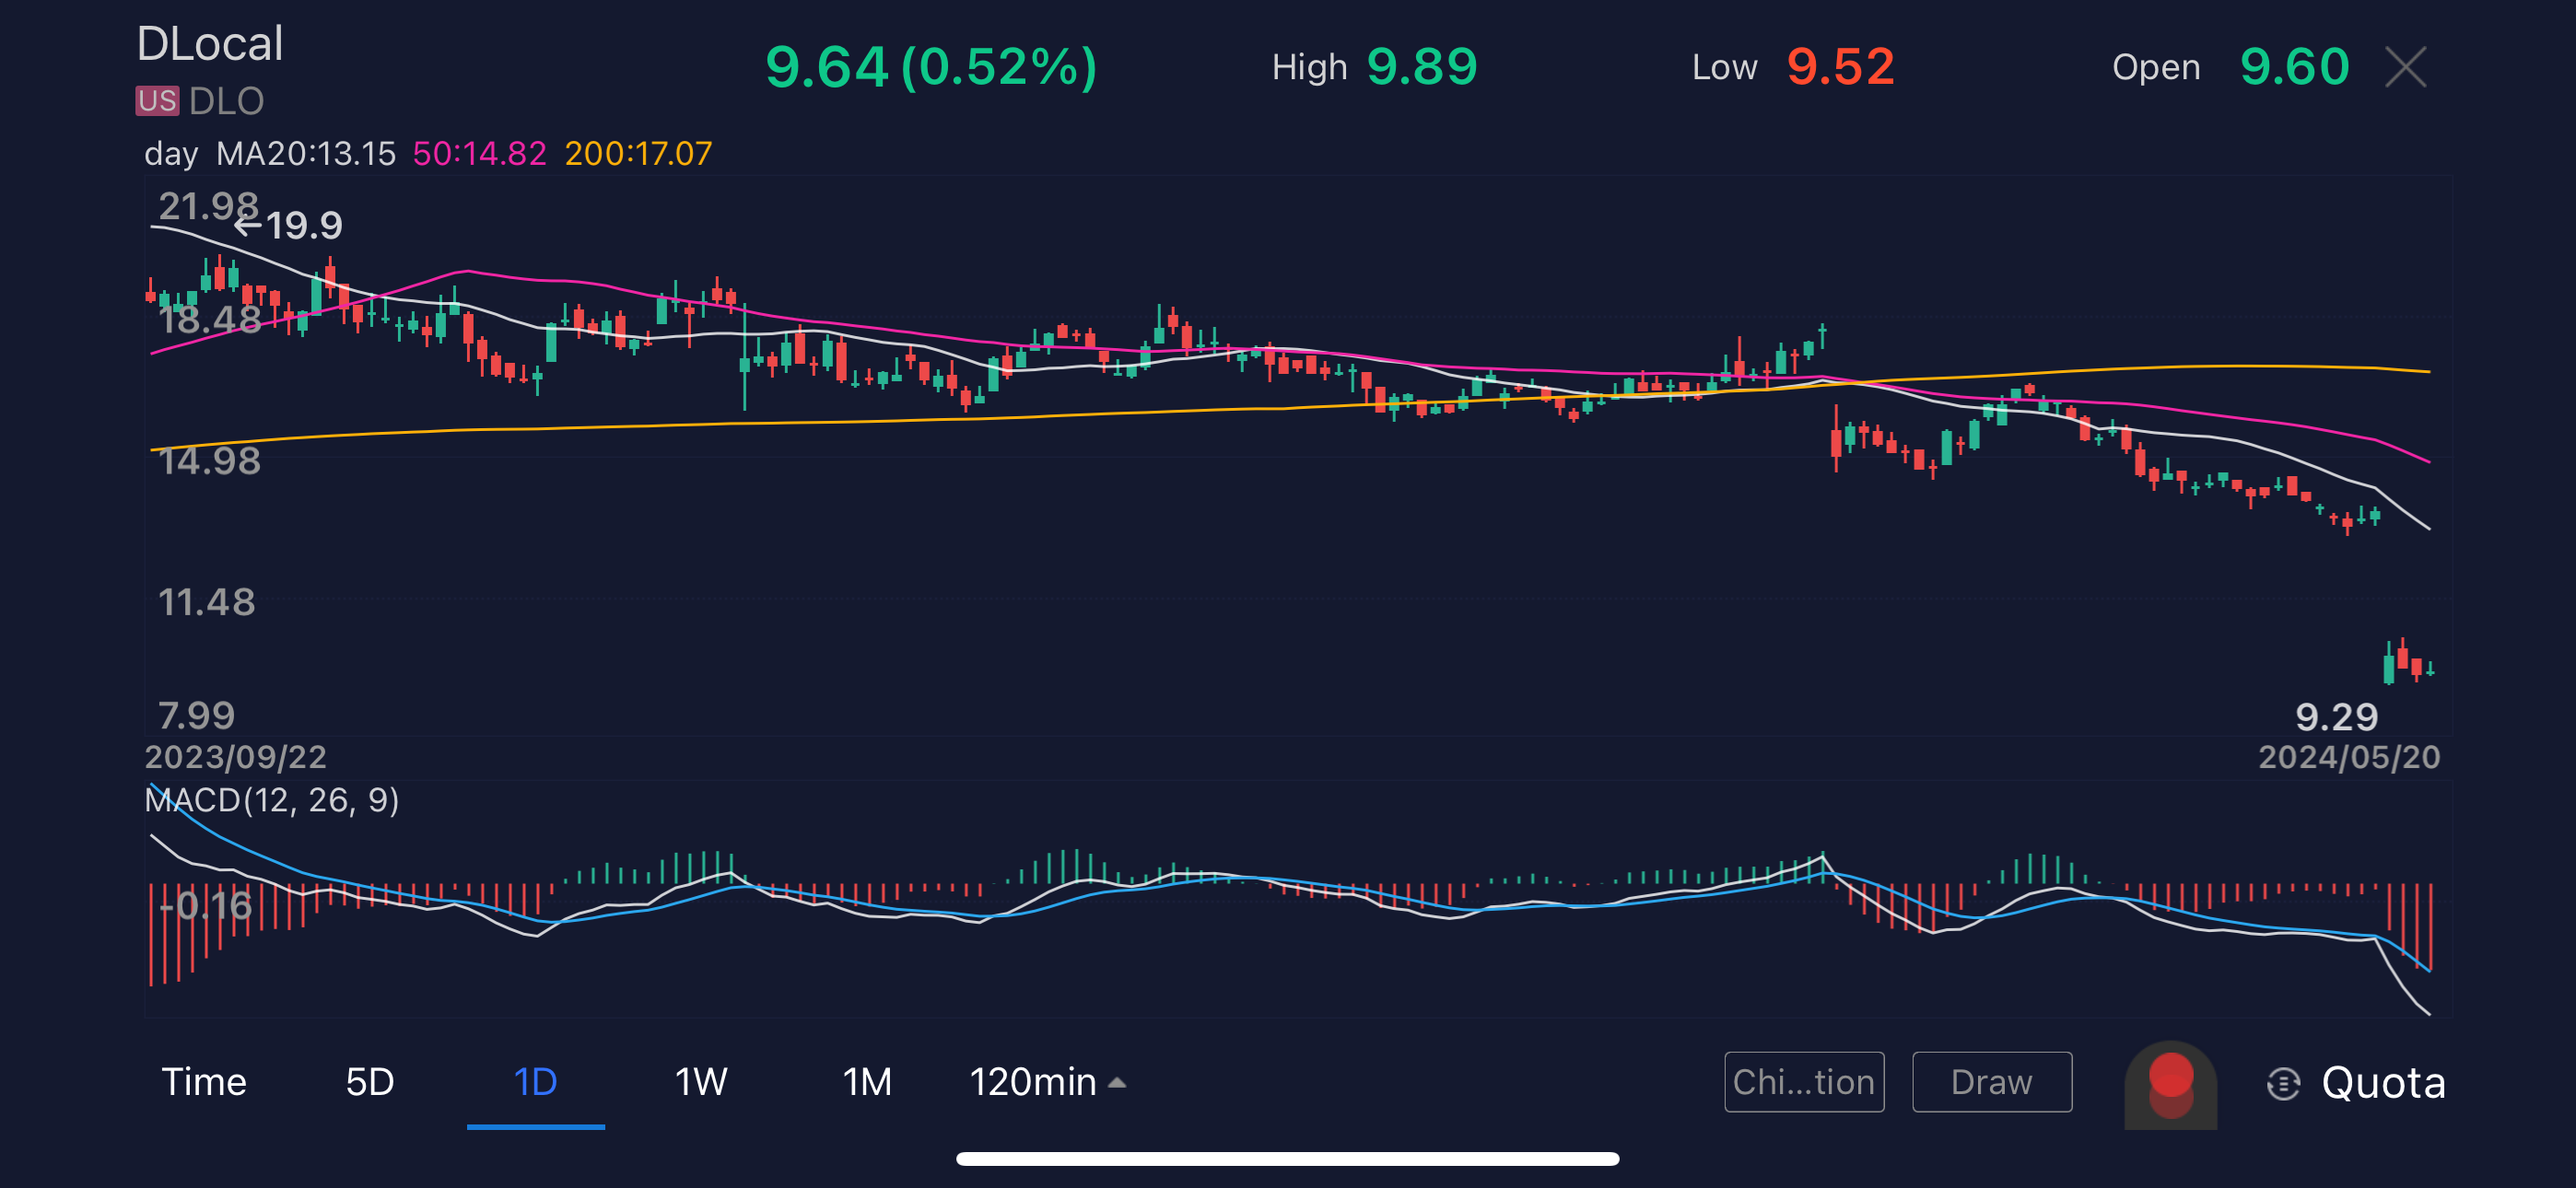
Shares of DLO tumbled from $13 to $9 following its earnings report. The stock is starting to create an island straddling the key psychological $10 level. There was a big buy bar on March 15 which suggests some buyers stepped into the name. We like this play as the risk is clearly set at the $9 level while a break of $10 could set it up to close the earnings gap.
Chegg, Inc ($CHGG(CHGG)CHGG--)- RSI 19
Chegg, Inc. (CHGG) offers a learning platform and support services for students. Its offerings include the Chegg Study Pack, Chegg Study, Chegg Writing, Chegg Math, Busuu language learning, Chegg Skills, advertising services, and both print and eTextbooks. The company was founded by Osman Rashid and Aayush Phumbhra on July 29, 2005, and is headquartered in Santa Clara, CA.
On April 30, Chegg reported Q1 adjusted EBITDA of $46.7 million, beating estimates, but Q2 guidance was notably below expectations, leading to a 7.1% drop in share price. The company forecasts Q2 revenues of $159-161 million, a decline of 8.2% quarter-over-quarter and 12.5% year-over-year. Analysts expressed concerns about Chegg's ability to stabilize and grow, citing secular challenges and competition from free AI tools like ChatGPT. Piper Sandler and Jefferies downgraded the stock, with lowered price targets of $6 and $4, respectively. Chegg also announced a leadership transition with CEO Dan Rosensweig moving to Chairman and Nathan Schultz stepping in as CEO. Despite efforts to integrate AI into its offerings, Chegg continues to struggle against free alternatives, leading to significant declines in its stock price. Other EdTech platforms like Coursera are similarly impacted by AI disruptions.
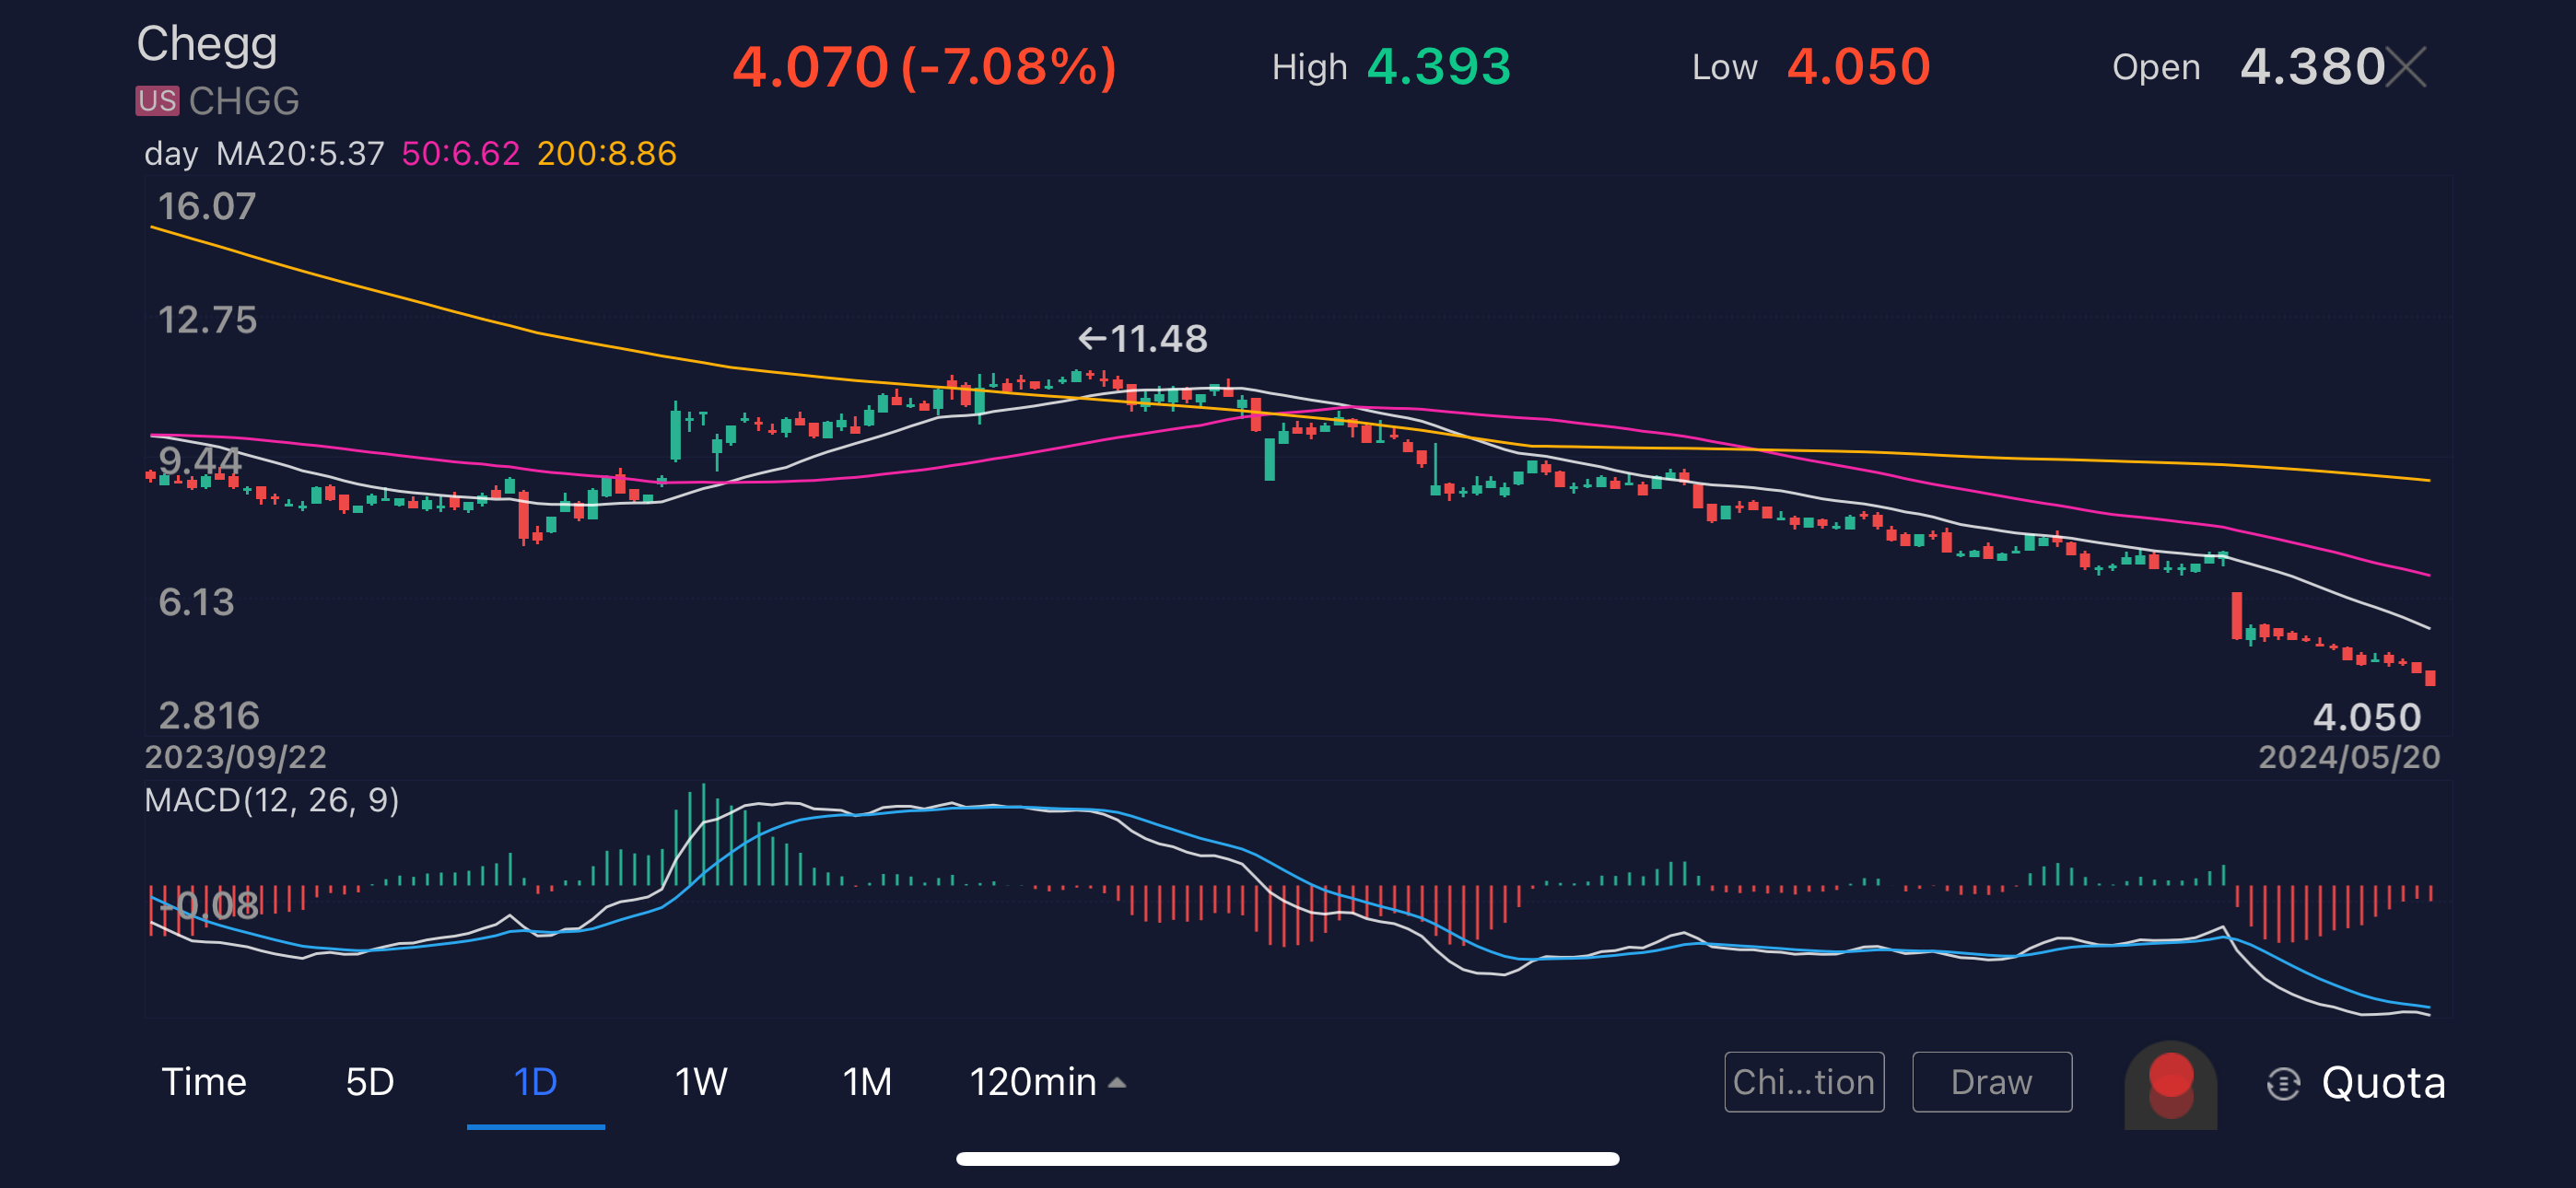
This has been on a steady decline since it hit a peak of $115 during the height in the first quarter of 2021. The steady decline has investors wondering whether this is a value play. We would see it as a value trap as the company is starting to see a rise in competition from AI sources. We would prefer to see some signs of buyers stepping in but nothing in the charts or data suggests evidence of investors putting money to work.
WEX Inc ($WEX(WEX)WEX--)- RSI- 20
WEX, Inc. provides payment processing and information management solutions, including fuel cards, fleet management, employee benefits, and business payments products. The company operates through three segments: Mobility, Corporate Payments, and Benefits. Founded by Parker Poole III and William Richardson in 1983, WEX is headquartered in Portland, ME.
For Q1, WEX reported an EPS of $3.46, slightly below the estimate of $3.48, and revenue of $652.70 million, marginally missing the estimate of $654.70 million. WEX, Inc. forecasts Q2 adjusted EPS between $3.75 and $3.85, below the estimate of $4.00, and FY adjusted EPS between $16.10 and $16.60, slightly above the forecast of $15.90 to $16.40. It also forecasts FY revenue between $2.73 billion and $2.77 billion, and Q2 revenue between $675 million and $685 million, close to the estimate of $679.4 million. Additionally, WEX announced a new long-term agreement with Booking.com starting April 2024.
WEX has a Forward P/E ratio of 12.31, lower than the industry average of 22.47. The company's PEG ratio is 1, compared to the industry's 1.40, and its P/B ratio is 4.95, against the industry's 7.49. WEX's P/CF ratio is 16.12, lower than the industry's average of 18.58.
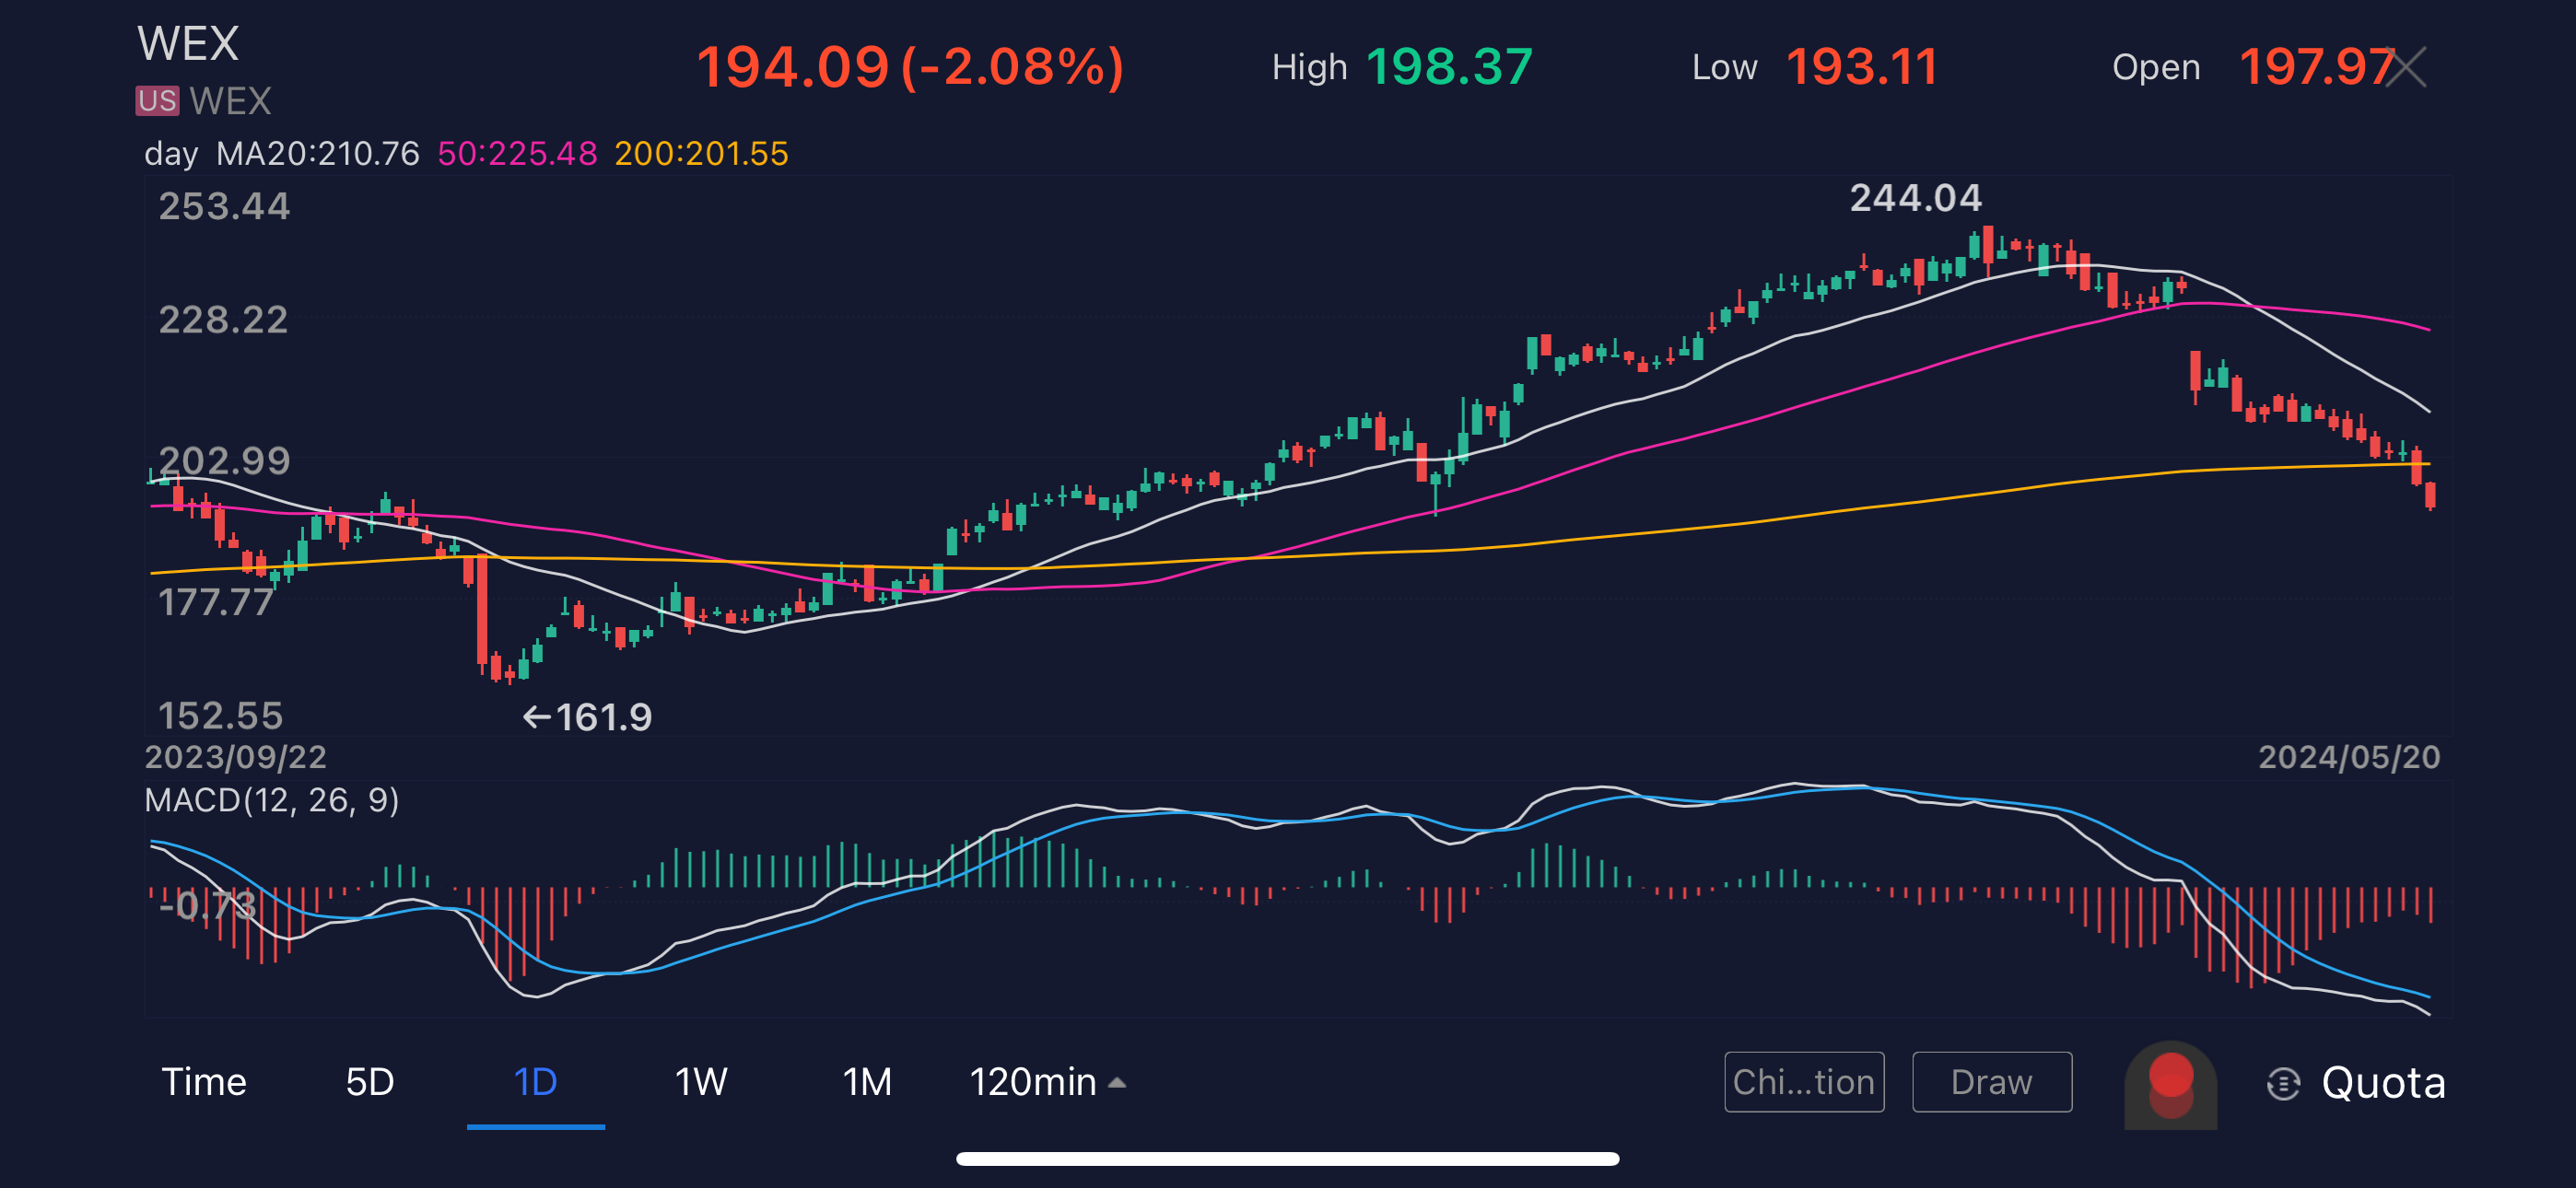
This stock has not found a bottom. It slipped below its 200-sma ($201) last Friday and has further downside to go. There will be some support at the $200-spyche which corresponds with the 50-day moving average ($198.75). But we would prefer to lean on a bounce as we see this stock headed to the $180 level before sellers are exhausted.
TripAdvisors ($TRIP(TRIP)TRIP--)- RSI- 22
TripAdvisor, Inc. is an online travel company that owns and operates a portfolio of travel brands. The company was founded by Nicholas Shanny and Stephen Kaufer in February 2000 and is headquartered in Needham, MA.
The company posted a Q1 EPS of $0.12, beating the $0.02 estimate, and revenue of $395M, slightly above the $394.3M estimate. However, shares fell after the company announced no beneficial third-party transactions. Key metrics included: Branded Hotels revenue $159M (est. $167.6M), Experiences and Dining revenue $36M (est. $154.6M), Viator revenue $141M (est. $138.4M), TheFork revenue $41M (est. $39.1M), ADJ EBITDA $47M (est. $46.8M), cash flow from operations $139M (est. $79.8M), and free cash flow $123M (est. $57.2M).
Tripadvisor's Q2 and FY guidance fell short of estimates and consensus, leading to a nearly 30% drop in shares since the earnings report. The decline also reflects the special committee's decision that no suitable transactions are available which disappointed investors. Wedbush believes a transaction could significantly unlock shareholder value. Their revised SOTP analysis implies a share value of $23, assuming a 1.5x multiple on 2025E Viator revenue and a 4.0x multiple on Brand Tripadvisor 2025E EBITDA. Wedbush sees potential for multiple expansion if Viator's margin potential is validated or if core business growth is reignited next year. DADA downgraded Tripadvisor from Buy to Neutral, reducing estimates and price target following Q1 results.
Although Q1 earnings were modestly ahead of forecasts, a soft start to Q2 and Easter-timing headwinds are expected to result in high-single-digit declines in Brand Tripadvisor segment revenues. Consequently, Tripadvisor has adopted a more cautious full-year outlook
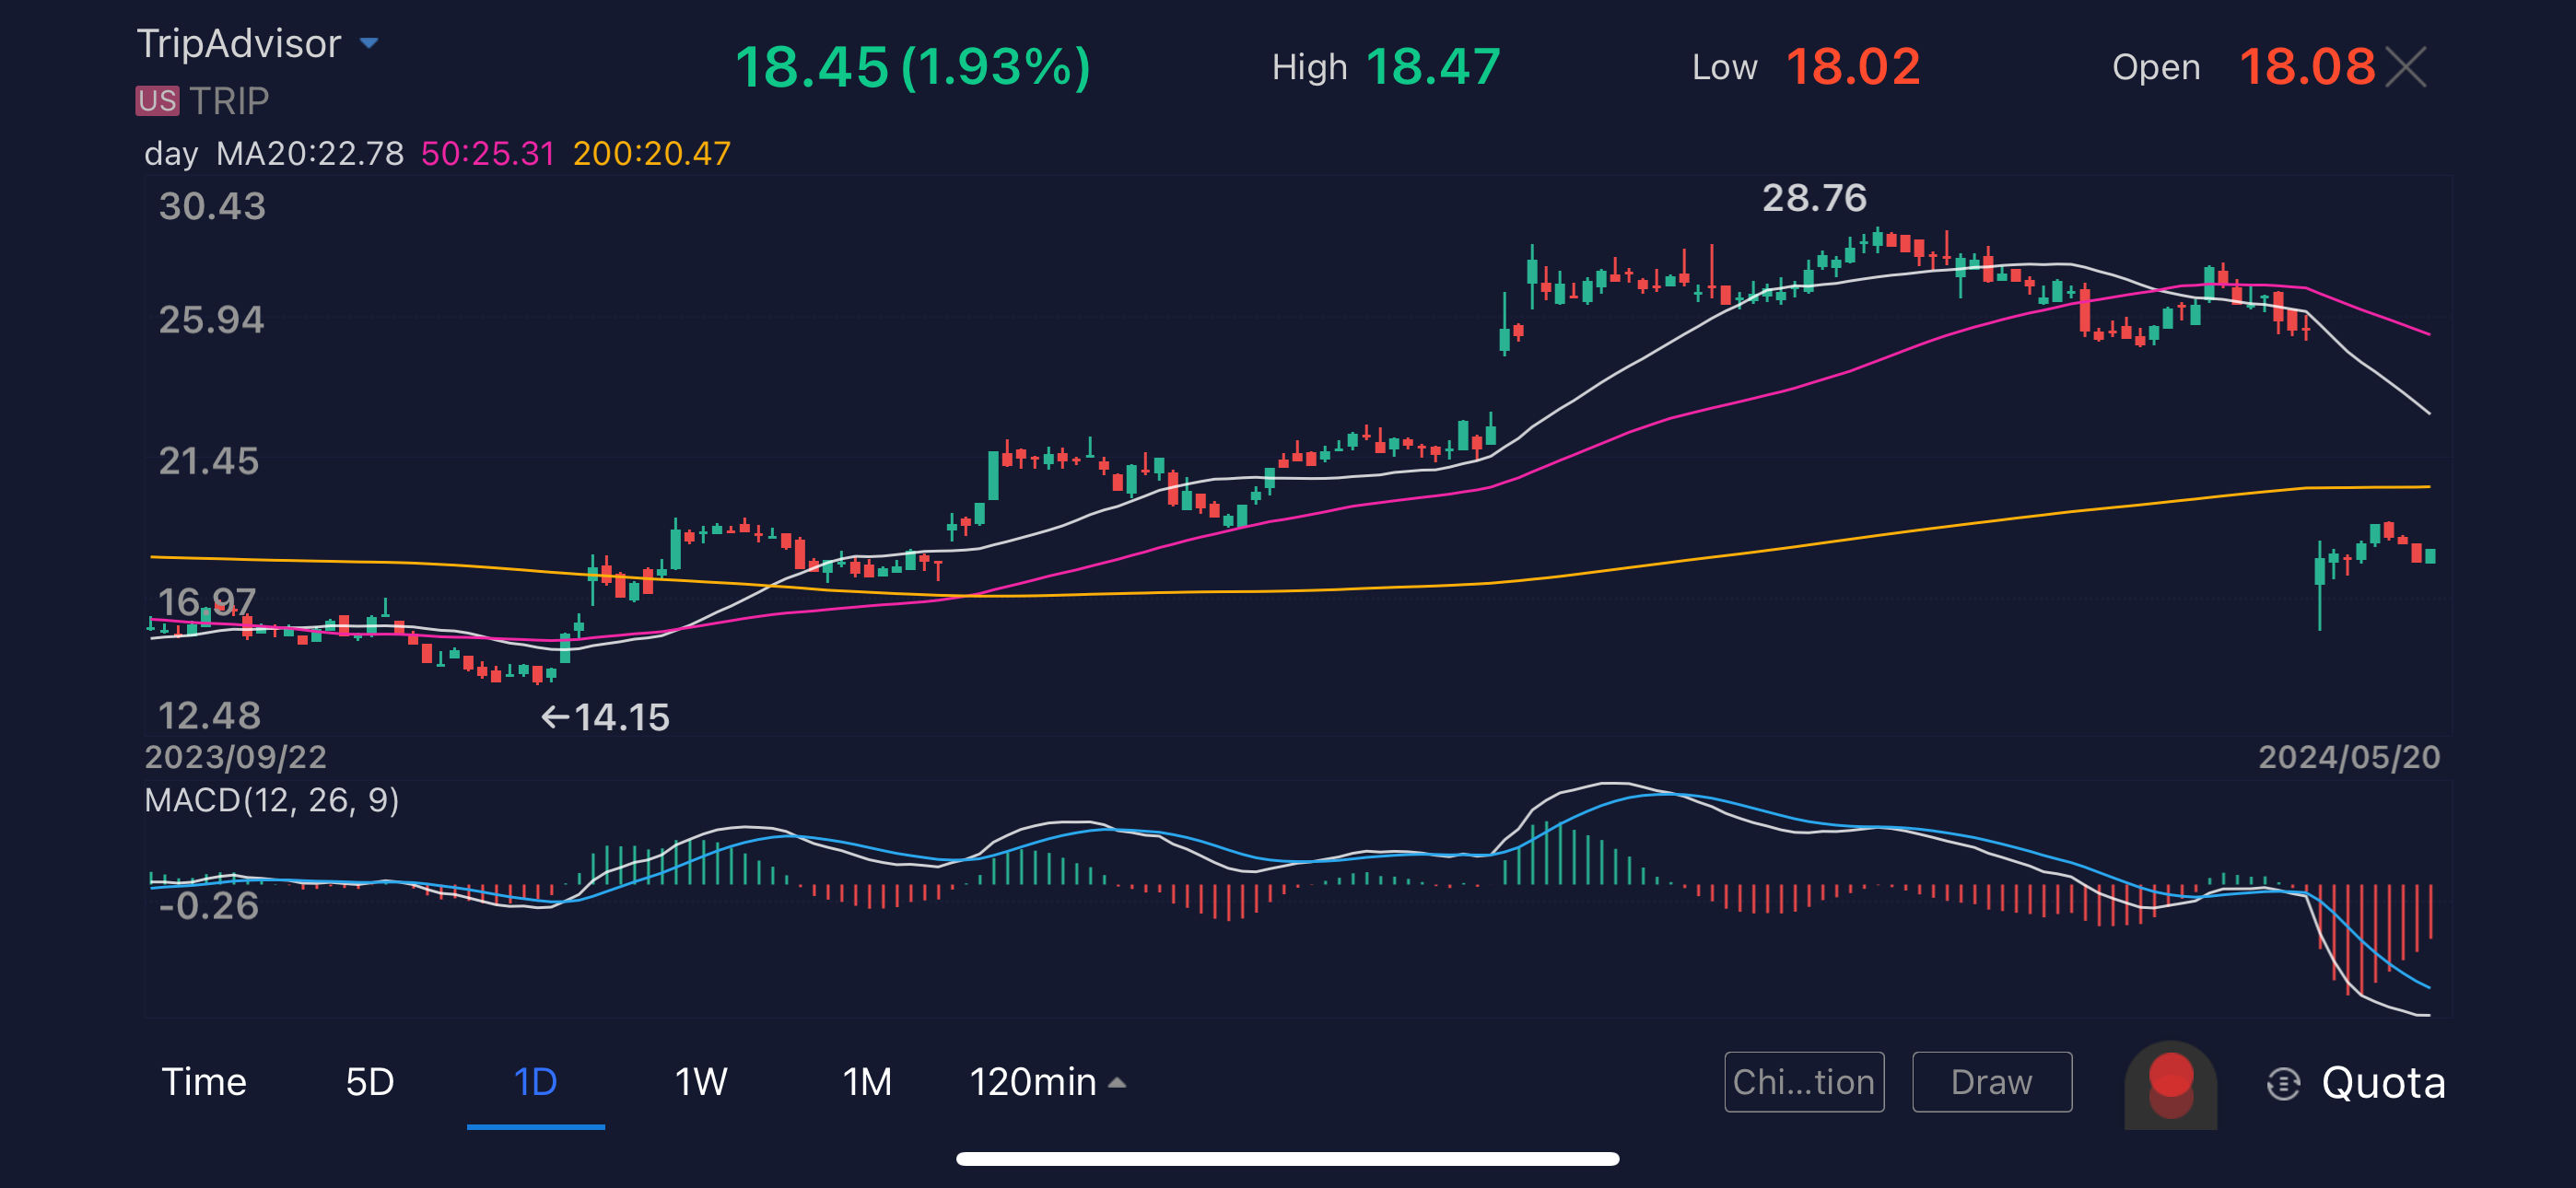
TRIP has found an island at the $17-19 range since its earnings flop. Investors will want to track the stock for a break above the $19.50 area which could set up for a push higher. However, the $20-psyche and the 200-day moving average ($20.47) could offer resistance. A break back below $18 should be a warning sign for traders.
Independent investment research powered by a team of market strategists with 20+ years of Wall Street and global macro experience. We uncover high-conviction opportunities across equities, metals, and options through disciplined, data-driven analysis.
Latest Articles
Unlock Market-Moving Insights.
Subscribe to PRO Articles.
Already have an account? Sign in
Unlock Market-Moving Insights.
Subscribe to PRO Articles.
Already have an account? Sign in
Stay ahead of the market.
Get curated U.S. market news, insights and key dates delivered to your inbox.


AInvest
PRO
AInvest
PRO