
LINKUSD1 Traps Buyers: Bollinger Bands Signal Imminent Breakout
Summary• LINKUSD1 traded in a tight $0.35 range, closing near session lows at $9.10 after a brief liquidity dip.• Momentum indicators suggest consolidation with neutral RSI and flat MACD lines amidst minimal volume participation.• Bollinger Bands contracted significantly, indicating low volatility and a potential pending breakout in the near term.• Turnover remained subdued with only two notable activity spikes occurring during early morning and late afternoon sessions.• Price action formed a simple descending channel, testing lower support levels without establishing a clear reversal pattern.
ChainLink/World Liberty Financial USD (LINKUSD1) opened at $9.43 and closed at $9.10, with a session high of $9.43 and a low of $9.08 over the 24-hour period. Total volume for the window was 188.49 units, generating a turnover of $1,713.24. The asset exhibited limited movement, characterized by extended periods of zero-volume candles and a slow decay from the opening price.
Technical Structure and Momentum
The 5-minute chart reveals a bearish drift from the $9.43 resistance level, where price action struggled to find immediate buyers. While specific candlestick patterns like engulfing bars are absent due to the lack of volume, the formation of lower highs suggests a cautious sentiment among participants. Moving averages for the 20 and 50 periods appear to be converging near the current price, which could imply an upcoming decision on direction. The Relative Strength Index (RSI) hovers in neutral territory, indicating that the asset is neither overbought nor oversold, but rather in a state of equilibrium. 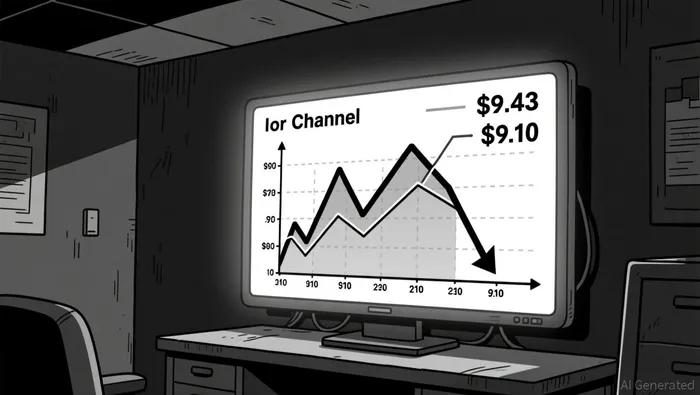
Volatility and Indicator Analysis
Bollinger Bands have contracted sharply, signaling a period of low volatility that often precedes a significant expansion in price movement. The price is currently trading near the lower band, which may suggest that downside momentum is waning, yet a definitive bounce is not confirmed without increased volume. MACD lines remain flat and close to the zero line, reinforcing the lack of strong directional momentum. Fibonacci retracement levels applied to the intraday swing suggest that the $9.08 low acted as a temporary floor, though the 61.8% retracement level remains a key area to watch for future support.
Volume and Turnover Dynamics
Turnover was minimal, with the majority of the 24-hour activity concentrated in two specific 5-minute intervals. The first spike occurred around 20:30 on March 25th, where a $52.82 trade volume pushed the price from $9.43 to $9.30. A second, larger spike appeared at 06:00 on March 26th, with a volume of 179.59 units causing a brief dip to $9.08 before a slight recovery. These isolated events appear to be noise rather than a sustained trend, as the subsequent candles show zero volume, suggesting a lack of institutional or retail conviction at current levels.
Looking ahead, the compressed volatility may lead to a breakout within the next 24 hours, though the direction remains uncertain without external catalysts. Investors should exercise caution as the low liquidity environment could result in exaggerated price swings during thin trading periods.
Decoding market patterns and unlocking profitable trading strategies in the crypto space
Latest Articles
Stay ahead of the market.
Get curated U.S. market news, insights and key dates delivered to your inbox.

AInvest
PRO
AInvest
PRO
Comments
No comments yet