
LHSW Plunges 30.76%: A Violent capitulation shakes the Software Infrastructure Sector
 Aime Summary
Summary
• SowellLHSW-- (LHSW) suffers a brutal intraday collapse, shedding over 30% of its value in a single session.
• The stock closed at $0.7062, marking a new 52-week low and signaling extreme distress for shareholders.

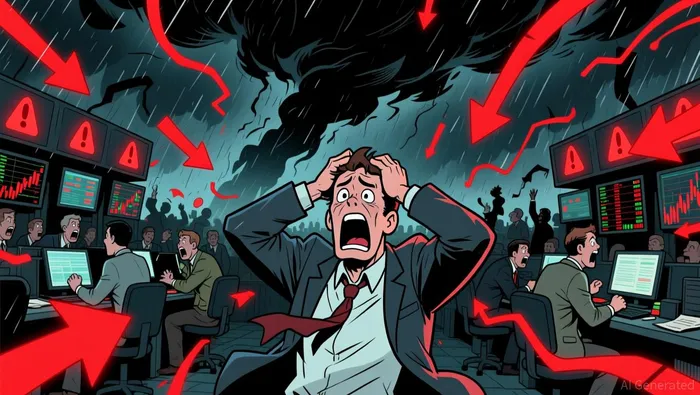
• Turnover rate exploded to 283.15%, indicating a chaotic war between sellers and a desperate scramble for liquidity.
• Intraday range widened significantly from an open of $0.97 to a low of $0.6631, reflecting intense volatility and panic selling pressure that overwhelmed any buying interest.
Liquidity Crisis and Technical Breakdown Drive Sowell's Sharp Decline
The precipitous drop in Sowell’s share price is driven by a confluence of severe technical breakdown and a liquidity vacuum. With the stock trading near its 52-week low of $0.6631, the market has lost confidence in the company's valuation, evidenced by a negative dynamic PE ratio of -1.67. The massive turnover rate of 283.15% suggests that the available float is changing hands rapidly as panic sets in. Without any specific positive corporate news to counterbalance the sentiment, the selling pressure has become self-reinforcing. The price action reflects a classic capitulation event where holders, fearing further downside, dump shares at any price, leading to the sharp 30.76% decline observed today.
Sowell's Bleed Contrasts with Stability in Software Infrastructure Leaders
While Sowell (LHSW) is hemorrhaging value, the broader Software - Infrastructure sector remains relatively stable, highlighting that the pain is idiosyncratic to the company rather than systemic. Microsoft (MSFT), the sector leader, posted a modest gain of 0.51%, demonstrating that institutional capital is still flowing into high-quality infrastructure plays. This divergence underscores that LHSW’s collapse is not a sector-wide rotation but a specific failure of confidence in Sowell’s fundamentals and technical structure. Investors are likely fleeing risky, low-priced small-caps in favor of established giants like MSFT, leaving LHSWLHSW-- isolated in a downward spiral.
Defensive Positioning and Technical Analysis Amidst High Volatility
The technical landscape for Sowell is overwhelmingly bearish, requiring extreme caution. Traders should note the following critical indicators:
• 50-day Moving Average: 2.99 (Price is drastically below, indicating severe weakness)
• 200-day Moving Average: 1.10 (Price has broken below the long-term trendline, confirming a bearish regime)
• RSI: 38.81 (Approaching oversold territory but lacks momentum for a reversal)
• MACD Histogram: -0.23 (Strong negative momentum, signaling continued selling pressure)
• Bollinger Bands: Price is trading well below the lower band of 1.30, suggesting an extreme deviation and potential for mean reversion or continued collapse.
Given the absence of leveraged ETF data and an empty options chain, trading this stock requires a spot-market technical approach rather than derivatives speculation. The key resistance levels are now anchored at the 200-day moving average of $1.10 and the recent support zone of $0.11–$0.25, which is dangerously close. The short-term trend is firmly bearish, with no signs of stabilization. Without liquid options to hedge or speculate on volatility, the risk-reward ratio for any long position is highly unfavorable. Aggressive traders might look for a bounce above the intraday high of $0.9999 as a sign of temporary relief, but the path of least resistance remains down.
With no options contracts provided in the chain, we cannot select specific calls or puts. Therefore, the strategy shifts to strict technical observation: watch for a break below the $0.66 support level to confirm further downside targets. If a bounce occurs, it is likely to be short-lived and sell-off opportunity rather than a trend reversal.
“If $0.66 breaks, expect accelerated downside; avoid catching the falling knife.”
Exit Risk: Monitor Support Breakdown and Sector Divergence
The current move in Sowell is unsustainable and reflects a deep loss of investor confidence rather than a healthy correction. The combination of a new 52-week low, negative earnings metrics, and extreme turnover suggests that the stock is in a danger zone. Investors should remain on the sidelines or reduce exposure, as the technical indicators provide no evidence of a bottom. Keep a close watch on the sector leader, Microsoft (MSFT), which gained 0.51% today, to gauge if any broader tech sentiment shift might offer a lifeline to distressed names like LHSW. However, given the isolation of LHSW’s decline, reliance on sector strength is risky. Watch for a decisive break below $0.66 or any regulatory reaction to the company’s financial health.

TickerSnipe provides professional intraday stock analysis using technical tools to help you understand market trends and seize short-term trading opportunities.
Latest Articles
Stay ahead of the market.
Get curated U.S. market news, insights and key dates delivered to your inbox.


AInvest
PRO
AInvest
PRO




Comments
No comments yet