
LGI Homes Outlook: Mixed Signals Amid Real Estate Market Shifts
News Highlights
Recent real estate-related news highlights a shifting landscape for the industry: New Jersey’s Bergen County to Tokenize $240B in Real Estate Deeds on AvalancheAVAX-- Network – This move could set a precedent for digitizing property records, potentially impacting long-term real estate transaction efficiency and LGI Homes’ operations. Clifton Blake’s Merger with Metropolitan Commercial Realty – This consolidation in the real estate sector underscores a broader trend of integration and could indirectly affect LGI Homes' competitive positioning. Nuveen Launches 1031 Real Estate Exchange Platform – As tax-efficient real estate investment solutions gain traction, LGI Homes may face indirect pressure to innovate or adjust its offerings.
Analyst Views & Fundamentals
LGI Homes currently holds a simple average analyst rating of 2.50 and a performance-weighted rating of 2.03, indicating a generally cautious stance among analysts. Ratings are dispersed, with one "Neutral" and one "Sell" in the most recent 20-day period.
These scores contradict the stock’s recent 7.72% price rise, signaling a disconnect between market sentiment and analyst expectations.
Key fundamental factor values (as of latest data): Revenue-MV Ratio: 0.878 (internal diagnostic score: 2) Price-to-Book (PB): 0.299 (internal diagnostic score: 2) Gross Profit Margin (GPM): 10.24% (internal diagnostic score: 3) Asset-MV Ratio: -0.449 (internal diagnostic score: 3) Cash-MV Ratio: 0.440 (internal diagnostic score: 2) Net Profit Margin (NPM): 4.97% (internal diagnostic score: 2)
Money-Flow Trends
LGI Homes is currently seeing positive inflows across most investor categories, with inflow ratios consistently above 0.5. Notably: Small investor inflow ratio: 50.35% Medium investor inflow ratio: 50.23% Large investor inflow ratio: 49.75% Extra-large investor inflow ratio: 52.32%
Despite positive inflows from both retail and institutional players, the fund-flow score of 7.88 (rated "good") contrasts with the weak technical signals. This suggests while money is flowing in, underlying momentum may be fragile.
Key Technical Signals
LGI Homes’ technical outlook is weak according to our internal diagnostic model, with a score of 2.19 out of 10.
Key indicators and scores: Williams %R Overbought: Internal diagnostic score 1 – Biased bearish with a historical average return of -2.85% and a win rate of just 25%. Williams %R Oversold: Internal diagnostic score 1.88 – Neutral bias with a slightly better win rate of 43% but still a negative average return of -0.14%. Marubozu White: Internal diagnostic score 1 – Biased bearish with a poor win rate of 26.67% and average return of -0.84%.
Recent chart patterns (last 5 days): 2025-11-21: WR Overbought, Marubozu White – bearish signals emerging 2025-11-20: WR Oversold – mixed signal 2025-11-19: WR Oversold – again mixed
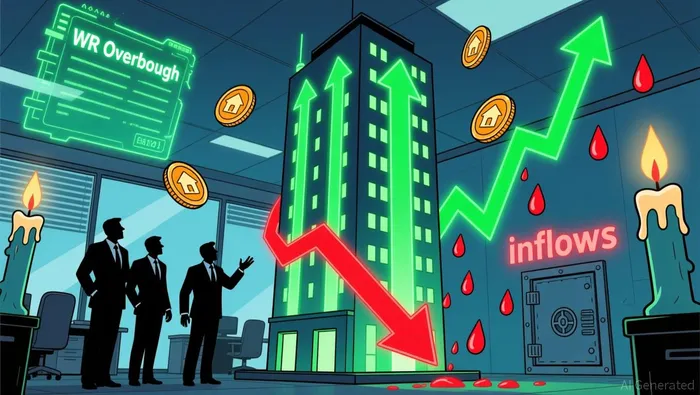
These signals align with the broader insight: Technical indicators show that the market is in a weak state, and we need to pay attention to the risk of decline. With 3 bearish signals and no bullish ones, the momentum is clearly negative.
Conclusion
While LGI Homes is attracting inflows and has shown a strong short-term price move, the technical and analyst signals tell a more cautionary tale. With bearish chart patterns, weak technical scores, and mixed analyst ratings, the outlook remains uncertain.
Actionable takeaway: Investors should consider waiting for a pull-back or wait for more clarity on earnings and market conditions before entering a long position.
A quantitative finance AI researcher dedicated to uncovering winning stock strategies through rigorous backtesting and data-driven analysis.
Latest Articles
Stay ahead of the market.
Get curated U.S. market news, insights and key dates delivered to your inbox.
AInvest
PRO
AInvest
PRO
Comments
No comments yet