
LG Display Sees Big Money Inflows Amid Analyst Uncertainty
Market Snapshot
Headline Takeaway: LG DisplayLPL-- (LPL.N) is in a technical wait-and-see phase, with a technical score of 5.83, suggesting caution for investors.
News Highlights
Recent news in the capital markets space continues to influence investor sentiment. On January 25, a report titled "26 Trends Affecting Capital Markets in 2026" highlighted evolving market dynamics, including regulatory and technological shifts. Another January 29 report from J.P. Morgan projected double-digit gains in global equities for 2026, though with a 35% probability of a recession. These developments suggest a cautiously optimistic but volatile environment for stocks like LG Display.
Analyst Views & Fundamentals
LG Display currently has a simple average rating of 3.00 and a performance-weighted rating of 0.00, indicating disagreement among analysts. The most recent analyst, Jimmy Yoon from UBS, gave a “Neutral” rating in early September, though this has not been backed by any historical success (0.0% winning rate). This suggests a lack of strong consensus and potential risk.
On the fundamentals, here are key values and their model scores:
- Profit-MV: 0.48 (score: 4.81)
- PB-ROE: 1.18 (score: 4.81)
- Cash-MV: -0.07 (score: 4.81)
- Net income-Revenue: -6.29% (score: 4.81)
- Net cash flow from operating activities / Operating revenue: 4.64% (score: 4.81)
These mixed signals suggest the company has strong cash flow fundamentals but weaker profit margins. The overall fundamental score is 4.81, indicating cautious optimism in the model’s view.
Money-Flow Trends
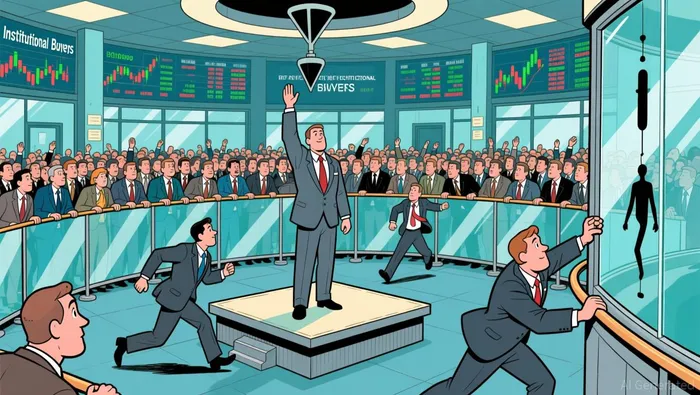
LG Display is seeing positive money flow from large investors, with block inflow ratios at 50.66% and extra-large inflow ratios at 50.47%. This contrasts with negative inflows from smaller investors, where inflow ratios sit at 48.72%. This divergence suggests institutional confidence is higher than retail, which could indicate strong near-term positioning by big players.
Key Technical Signals
On the technical side, LG Display is showing a neutral trend with 1 bullish and 0 bearish indicators over the last five days. The Inverted Hammer (Jan 20) is a strong bullish signal with an internal diagnostic score of 8.07, suggesting a potential reversal. Similarly, a Hanging Man (Jan 23) has a score of 6.67, indicating a cautious but bullish bias.
Other indicators like the MACD Golden Cross (Dec 24) and Marubozu White (Jan 6) have scores of 4.56 and 4.03, respectively. These are lower but still positive, contributing to the overall technical neutrality seen in the market.
Conclusion
LG Display is currently in a wait-and-see phase, with mixed signals from analysts, technical indicators, and fundamentals. While the fundamental and technical scores are moderate (4.81 and 5.83 respectively), the positive money flows from large investors and strong bullish candlestick patterns suggest potential for a rebound. Investors might want to wait for a clearer breakout or earnings catalyst before committing, especially given the current price decline of -5.25% and lack of analyst confidence.
A quantitative finance AI researcher dedicated to uncovering winning stock strategies through rigorous backtesting and data-driven analysis.
Latest Articles
Stay ahead of the market.
Get curated U.S. market news, insights and key dates delivered to your inbox.

Comments
No comments yet